AggV3 sample quality metrics
We provide a set of sample-level quality control (QC) metrics for the samples in aggV3, including coverage metrics and those generated during alignment and variant calling. Sample quality metrics are provided as a table that can be accessed via CloudOS, where the table is available in an S3 bucket at s3://512426816668-gel-data-resources/dragen3.7.8/AggV3_resources/sampleqc_resources/sample_qc_aggregated.csv.
The distributions of key quality metrics across all samples are available.
Future updates to sample quality metrics
For the initial release, samples have not been excluded based on their quality metrics. You may choose to apply your own sample QC criteria using the metrics provided, depending on your analysis needs. In future releases, we plan to conduct a quality assessment and provide sample-level flags to indicate those we consider lower quality.
DRAGEN 3.7.8 QC metrics
Many of the metrics were generated by DRAGEN 3.7.8 during sample re-alignment and are available in various .csv files alongside other sample-level outputs from the pipeline. For convenience, we have aggregated a select set of these metrics for aggV3 samples into a single table. To facilitate programmatic use, we standardised the naming conventions of the metrics originally produced by DRAGEN.
Please note that because variant call metrics refer to those from DRAGEN 3.7.8, they may not be identical to those observed in the aggregate data which uses ML-recalibrated DRAGEN-called variants as input, but should act as a relative proxy.
The table below lists each metric name as it is in the provided table, its original name from the DRAGEN pipeline and the source .csv file.
| Original DRAGEN name | Standardised name | DRAGEN output file |
|---|---|---|
| Total input reads | total_input_reads |
PLATEKEY.mapping_metrics.csv |
| Mapped reads | mapped_reads |
PLATEKEY.mapping_metrics.csv |
| Total alignments | total_alignments |
PLATEKEY.mapping_metrics.csv |
| Supplementary (chimeric) alignments | supplementary_chimeric_alignments |
PLATEKEY.mapping_metrics.csv |
| Insert length: median | insert_length_median |
PLATEKEY.mapping_metrics.csv |
| Insert length: mean | insert_length_mean |
PLATEKEY.mapping_metrics.csv |
| Insert length: standard deviation | insert_length_standard_deviation |
PLATEKEY.mapping_metrics.csv |
| Unmapped reads | unmapped_reads |
PLATEKEY.mapping_metrics.csv |
| Number of duplicate marked reads | number_of_duplicate_marked_reads |
PLATEKEY.mapping_metrics.csv |
| Number of unique reads (excl. duplicate marked reads) | number_of_unique_reads_excl_duplicate_marked_reads |
PLATEKEY.mapping_metrics.csv |
| Number of unique & mapped reads (excl. duplicate marked) | number_of_unique_mapped_reads_excl_duplicate_marked_reads |
PLATEKEY.mapping_metrics.csv |
| Singleton reads (itself mapped; mate unmapped) | singleton_reads_itself_mapped_mate_unmapped |
PLATEKEY.mapping_metrics.csv |
| Paired reads (itself & mate mapped) | paired_reads_itself_mate_mapped |
PLATEKEY.mapping_metrics.csv |
| Properly paired reads | properly_paired_reads |
PLATEKEY.mapping_metrics.csv |
| Not properly paired reads (discordant) | not_properly_paired_reads_discordant |
PLATEKEY.mapping_metrics.csv |
| Paired reads mapped to different chromosomes | paired_reads_mapped_to_different_chromosomes |
PLATEKEY.mapping_metrics.csv |
| Provided sex chromosome | provided_sex_chromosome |
PLATEKEY.mapping_metrics.csv |
| Supplementary (chimeric) alignments % | supplementary_chimeric_alignments_percentage |
PLATEKEY.mapping_metrics.csv |
| Mapped reads % | mapped_reads_percentage |
PLATEKEY.mapping_metrics.csv |
| Unmapped reads % | unmapped_reads_percentage |
PLATEKEY.mapping_metrics.csv |
| Number of duplicate marked reads % | number_of_duplicate_marked_reads_percentage |
PLATEKEY.mapping_metrics.csv |
| Number of unique reads (excl. duplicate marked reads) % | number_of_unique_reads_excl_duplicate_marked_reads_percentage |
PLATEKEY.mapping_metrics.csv |
| Number of unique & mapped reads (excl. duplicate marked) % | number_of_unique_mapped_reads_excl_duplicate_marked_reads_percentage |
PLATEKEY.mapping_metrics.csv |
| Singleton reads (itself mapped; mate unmapped) % | singleton_reads_itself_mapped_mate_unmapped_percentage |
PLATEKEY.mapping_metrics.csv |
| Paired reads (itself & mate mapped) % | paired_reads_itself_mate_mapped_percentage |
PLATEKEY.mapping_metrics.csv |
| Properly paired reads % | properly_paired_reads_percentage |
PLATEKEY.mapping_metrics.csv |
| Not properly paired reads (discordant) % | not_properly_paired_reads_discordant_percentage |
PLATEKEY.mapping_metrics.csv |
| Paired reads mapped to different chromosomes % | paired_reads_mapped_to_different_chromosomes_percentage |
PLATEKEY.mapping_metrics.csv |
| PCT of genome with coverage [15x: inf) | pct_of_genome_with_coverage_15x_inf |
PLATEKEY.vc_metrics.csv |
| Average chr X coverage over genome | average_chr_x_coverage_over_genome |
PLATEKEY.vc_metrics.csv |
| Average chr Y coverage over genome | average_chr_y_coverage_over_genome |
PLATEKEY.vc_metrics.csv |
| Average mitochondrial coverage over genome | average_mitochondrial_coverage_over_genome |
PLATEKEY.vc_metrics.csv |
| Average autosomal coverage over genome | average_autosomal_coverage_over_genome |
PLATEKEY.vc_metrics.csv |
| Median autosomal coverage over genome | median_autosomal_coverage_over_genome |
PLATEKEY.vc_metrics.csv |
| SNPs | snps |
PLATEKEY.wgs_coverage_metrics.csv |
| Het/Hom ratio | het_hom_ratio |
PLATEKEY.wgs_coverage_metrics.csv |
| Total | total |
PLATEKEY.wgs_coverage_metrics.csv |
| Biallelic | biallelic |
PLATEKEY.wgs_coverage_metrics.csv |
| Multiallelic | multiallelic |
PLATEKEY.wgs_coverage_metrics.csv |
| SNP Transitions | snp_transitions |
PLATEKEY.wgs_coverage_metrics.csv |
| SNP Transversions | snp_transversions |
PLATEKEY.wgs_coverage_metrics.csv |
| Ti/Tv ratio | ti_tv_ratio |
PLATEKEY.wgs_coverage_metrics.csv |
| Heterozygous | heterozygous |
PLATEKEY.wgs_coverage_metrics.csv |
| Homozygous | homozygous |
PLATEKEY.wgs_coverage_metrics.csv |
| Insertions (Hom) | insertions_hom |
PLATEKEY.wgs_coverage_metrics.csv |
| Insertions (Het) | insertions_het |
PLATEKEY.wgs_coverage_metrics.csv |
| Deletions (Hom) | deletions_hom |
PLATEKEY.wgs_coverage_metrics.csv |
| Deletions (Het) | deletions_het |
PLATEKEY.wgs_coverage_metrics.csv |
| Indels (Het) | indels_het |
PLATEKEY.wgs_coverage_metrics.csv |
| SNPs % | snps_percentage |
PLATEKEY.wgs_coverage_metrics.csv |
| Biallelic % | biallelic_percentage |
PLATEKEY.wgs_coverage_metrics.csv |
| Multiallelic % | multiallelic_percentage |
PLATEKEY.wgs_coverage_metrics.csv |
| Insertions (Hom) % | insertions_hom_percentage |
PLATEKEY.wgs_coverage_metrics.csv |
| Insertions (Het) % | insertions_het_percentage |
PLATEKEY.wgs_coverage_metrics.csv |
| Deletions (Hom) % | deletions_hom_percentage |
PLATEKEY.wgs_coverage_metrics.csv |
| Deletions (Het) % | deletions_het_percentage |
PLATEKEY.wgs_coverage_metrics.csv |
| Indels (Het) % | indels_het_percentage |
PLATEKEY.wgs_coverage_metrics.csv |
| Ploidy estimation | dragen_karyotypic_sex_estimation |
PLATEKEY.dragen_karyotypic_sex_estimation_metrics.csv |
| Autosomal median coverage | autosomal_median_coverage |
PLATEKEY.ploidy_estimation_metrics.csv |
| X median coverage | x_median_coverage |
PLATEKEY.ploidy_estimation_metrics.csv |
| Y median coverage | y_median_coverage |
PLATEKEY.ploidy_estimation_metrics.csv |
DNA contamination
In addition to the QC metrics generated by DRAGEN, we calculated a measure of DNA contamination using a method described by Lu et al. called CHARR (Contamination from Homozygous Alternate Reference reads). CHARR estimates contamination by examining biallelic homozygous alternate variants. The presence of unexpected reference reads at these sites is interpreted as a signal of potential contamination. This signal is quantified - accounting for population allele frequencies - by assigning per-variant contamination values and averaging them to produce a sample-level estimate.
To compute CHARR scores, we used allele frequencies from aggV2, restricted to biallelic SNPs that had not undergone MNP-to-SNP decomposition. The aggV2 allele frequency file used for calculating CHARR is available at s3://512426816668-gel-data-resources/dragen3.7.8/AggV3_resources/sampleqc_resources/gel_af_filtered.vcf.gz.
For each sample, variants meeting the following criteria were extracted from their DRAGEN gVCF:
- Autosomal biallelic SNP
- 20 ≤ DP ≤ 100
- GQ ≥ 20
- AN from aggV2 (AN_whole_cohort) > 20,000
- 0.15 ≤ AF from aggV2 (AF_whole_cohort) ≤ 0.85
- Homozygous alternate genotype
Variant-level values were then calculated using the formula:
where \(ABref_{variant}\) is the reference allele balance of a variant, \(ADref_{variant}\) is the number of reads supporting the reference allele, and \(ADalt_{variant}\) is the number of reads supporting the alternate allele.
The final CHARR score was calculated by dividing \(ABref_{variant}\) by the respective allele frequency \(AF_{variant}\) and getting an average across all variants.
For each sample, we report the CHARR score as charr_score and the number of variants used for its calculation (charr_total_variants) in the table of quality metrics. We also provide a metric named charr_total_na_variants which quantifies the number of variants in a sample for which a variant-level CHARR score could not be calculated.
Comparison of CHARR with VerifyBamID
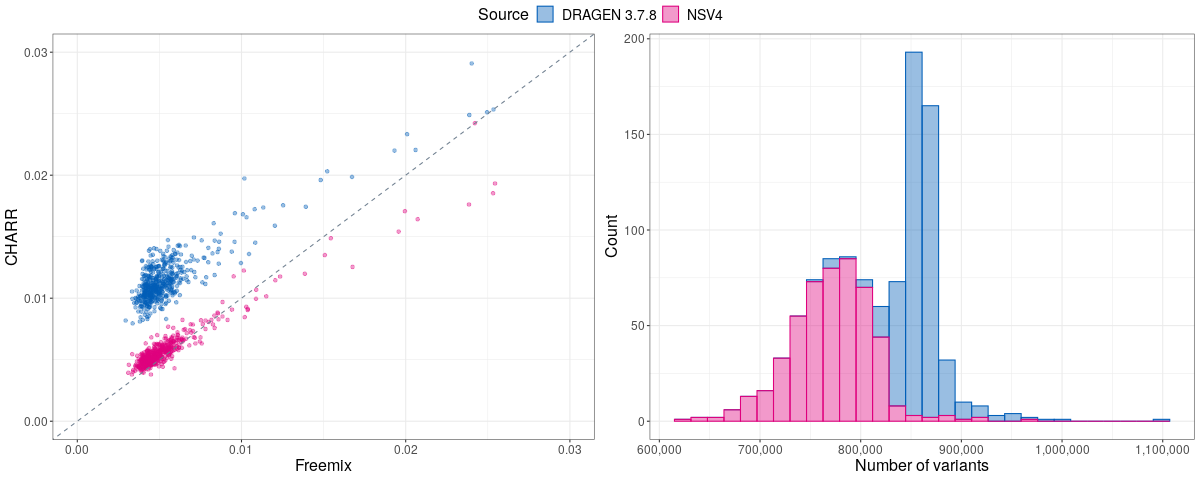
In their original publication, the authors demonstrated that CHARR strongly correlates with Freemix from VerifyBamId. To validate our implementation of CHARR, we calculated contamination estimates for 500 samples in aggV2 using two sets of variant calls: one generated by the NSV4 pipeline and another by DRAGEN 3.7.8. We then compared both sets of CHARR estimates to their Freemix values. Overall, we observed a strong correlation between the two measures, with CHARR estimates tending to be slightly higher when calculated based on DRAGEN-called variants. This inflation is likely due to the increased number of variants called by the DRAGEN pipeline.
The figure below illustrates this correlation (left panel) and shows the corresponding number of variants used to calculate the CHARR score (right panel).