Summary statistics across genetically-inferred ancestry groups for 100,000 Genomes Project participants¶
Here we provide summary statistics, stratified by genetically-inferred ancestry groups, for the AggV2 dataset. AggV2 is an aggregate of gVCFs comprising high-quality germline genomes from genetically diverse individuals derived from release 10 of the 100,000 Genomes Project (100kGP) dataset. Summary statistics include basic demographic data, information on socio-economic status, population structure, sample sources, sequencing quality, genotype and disease status. We provide these data as a reference and to help guide you analysing data from AggV2 where there is a need to take potential confounders related to ancestral diversity into account.
Participants¶
This analysis covers 76,849 individuals recruited to the 100kGP that are included in AggV2. We excluded participants who have withdrawn from the study after recruitment (N = 9); with indeterminate sex or mismatched self-reported and genotype sex traits (N = 1,284) from our analysis, leaving 76,849 participants.
Ancestry group classification¶
Participants were classified into five super-population groups based on PC scores. Participants who didn’t meet the criteria for classification into super-population groups were classified as “unassigned” (See Definition of phenotypes). All analysed participants had genomes aligned to GRCh38.
The following tables include summary statistics based on genetically inferred ancestry groups. These are genetic summary statistics that don’t consistently correspond to observable phenotypes. This, together with the fact that all extracted phenotypes have more than five participants (sum of the rows), ensures compliance with the current Airlock policy.
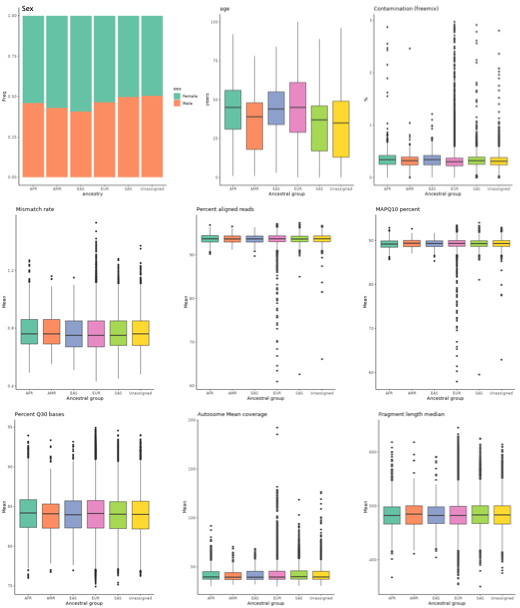
Figure 1. Distribution of key variables across genetically inferred ancestry groups.
Phenotypes with fewer than five patients are not displayed.
Characteristics of all participants across populations¶
| Phenotypes‡ | AFR (N = 1967; 2.6%) |
AMR (N = 238; 0.3%) |
EAS (N = 505; 0.7%) |
EUR (N = 61,279; 79.7%) |
SAS (N = 7,077; 9.2%) |
Unassigned (N = 5,783; 7.5%) |
|---|---|---|---|---|---|---|
| Age (Min – Max) | 45 (25; 1-98) | 39 (30; 1-78) | 44 (21; 0-91) | 45 (32; 0-100) | 37 (29; 0-89) | 35 (36; 0-96) |
| Sex (M / F, %) | 46.1 / 53.9 | 42.9 / 57.1 | 40.6 / 59.4 | 46.5 / 53/5 | 49.7 / 50.3 | 50.4 / 49.6 |
| Socio-economic status | ||||||
| Deprivation (%) | ||||||
| Lowest | 20.1 | 9.3 | 10.7 | 8.8 | 24.3 | 15.5 |
| Lower middle | 61 | 51.4 | 47.2 | 38.2 | 50.8 | 48.1 |
| Upper middle | 15.8 | 27.9 | 32.6 | 41.8 | 20.8 | 29.7 |
| Highest | 3.1 | 11.4 | 9.4 | 11.3 | 4.1 | 6.8 |
| Index of Multiple Deprivation (Rank) | 32.4 (21.8) | 20.3 (23.9) | 20.9 (24.4) | 16.0 (18.9) | 29.6 (27.1) | 23.8 (25.7) |
| Population structure | ||||||
| Self-reported ethnicity (%) | ||||||
| Asian | 0.3 | 0.0 | 69.3 | 0.0 | 78.5 | 11.2 |
| Black | 73.5 | 0.4 | 0.0 | 0.0 | 0.4 | 6.0 |
| White | 2.9 | 40.3 | 2.4 | 84.1 | 0.9 | 36.6 |
| Mixed | 4.6 | 13.9 | 2.0 | 0.4 | 1.1 | 17.2 |
| Not known | 0.5 | 1.3 | 0.4 | 0.9 | 0.6 | 0.4 |
| Not stated | 16.8 | 16.8 | 14.3 | 14.3 | 17.0 | 18.0 |
| Other | 1.4 | 27.3 | 11.7 | 0.4 | 1.6 | 10.7 |
| Sample source (%) | ||||||
| Blood | 99.1 | 99.2 | 98.0 | 98.7 | 99.4 | 99.0 |
| Fibroblast | 0.1 | 0.0 | 0.2 | 0.1 | 0.1 | 0.1 |
| Saliva | 0.7 | 0.4 | 0.8 | 1.0 | 0.4 | 0.6 |
| Tissue | 0.2 | 0.4 | 1.0 | 0.1 | 0.1 | 0.3 |
| Sequencing quality† | ||||||
| Callability (%) | 95.21 (0.64) | 95.21 (0.69) | 95.18 (0.67) | 95.28 (0.66) | 95.30 (0.66) | 95.31 (0.66) |
| Array concordance (%) | 99.95 (0.0001) | 99.96 (0.0001) | 99.96 (0.003) | 99.96 (0.01) | 99.96 (0.0001) | 99.96 (0.0001) |
| Contamination | 0.0034 (0.002) | 0.0032 (0.002) | 0.0034 (0.002) | 0.0030 (0.002) | 0.0032 (0.001) | 0.0031 (0.001) |
| Sequencing coverage | ||||||
| All chromosomes | 39.28 (7.71) | 38.80 (6.87) | 39.06 (7.84) | 39.09 (8.22) | 39.46 (8.48) | 39.11 (8.11) |
| Autosomal chromosomes | 39.72 (7.9) | 39.45 (7.26) | 39.45 (8.33) | 39.58 (8.37) | 39.97 (8.57) | 39.63 (8.21) |
| Mapping Quality (%) | ||||||
| Percent MAPQ 10 read | 89.19 (1.45) | 89.37 (1.43) | 89.31 (1.33) | 89.34 (1.33) | 89.29 (1.31) | 89.30 (1.35) |
| Autosome Coverage at 15X | 96.03 (0.35) | 96.05 (0.34) | 96.03 (0.37) | 96.07 (0.37) | 96.08 (0.38) | 96.06 (0.36) |
| Average base call quality | 36.7 (1.0) | 36.6 (0.9) | 36.6 (1.0) | 36.7 (0.9) | 36.7 (1.0) | 36.7 (1.0) |
| Percent aligned reads (%) | 93.7 (1.50) | 93.7 (1.41) | 93.7 (1.39) | 93.7 (1.37) | 93.7 (1.30) | 93.7 (1.36) |
| Percent Q30 bases (%) | 84.19 (3.51) | 84.09 (3.05) | 83.96 (3.42) | 84.12 (3.48) | 84.03 (3.39) | 84.01 (3.50) |
| Sample error rate | 0.0100 (0.0019) | 0.0098 (0.0018) | 0.0099 (0.002) | 0.0097 (0.0018) | 0.0097 (0.0019) | 0.0097 (0.0019) |
| Mismatch rate (%) | 0.76 (0.17) | 0.76 (0.17) | 0.75 (0.18) | 0.75 (0.18) | 0.75 (0.17) | 0.76 (0.17) |
| Fragment length median | 482 (32) | 485 (34) | 482 (31) | 482 (33) | 483 (33) | 483 (34) |
| Genotype | ||||||
| Number of variants | ||||||
| Indel (per 10000) | 118.1 (3.26) | 100 (3.72) | 98.3 (2.39) | 97.5 (2.38) | 99.1 (2.91) | 99.8 (4.92) |
| SNV (per 10000) | 473.6 (3.26) | 400.8 (3.72) | 393.8 (2.39) | 391.6 (2.38) | 398.3 (2.91) | 398.6 (4.92) |
| Indel + SNV (per 10000) | 592 (9.8) | 500.8 (15.3) | 492 (5.2) | 489.2 (5.2) | 497.7 (10.0) | 498.1 (19.5) |
| Transition/transversion ratio | 2.065 (0.003) | 2.062 (0.003) | 2.056 (0.003) | 2.062 (0.003) | 2.060 (0.004) | 2.062 (0.004) |
| Indel Het/Hom ratio | 2.92 (0.12) | 2.29 (0.16) | 1.84 (0.05) | 2.14 (0.04) | 2.17 (0.25) | 2.24 (0.27) |
| Deletion Het/Hom ratio | 3.20 (0.13) | 2.46 (0.19) | 1.97 (0.06) | 2.29 (0.05) | 2.32 (0.27) | 2.40 (0.30) |
| Insertion Het/Hom ratio | 2.67 (0.11) | 2.14 (0.14) | 1.74 (0.05) | 2.01 (0.04) | 2.03 (0.24) | 2.10 (0.25) |
| SNP Het/Hom ratio | 2.01 (0.09) | 1.68 (0.12) | 1.35 (0.03) | 1.58 (0.03) | 1.59 (0.17) | 1.65 (0.17) |
AFR, African ancestry; AMR, Admixed American ancestry; EAS, East Asian ancestry, EUR; European ancestry; SAS, South Asian ancestry.
‡Median (IQR) for continuous variables. Median (IQR, min-max) for age. †Sample sizes for sequencing quality metrics are different from those stated in the top panel as these cover blood samples only; AFR (N = 1,949; 2.6%), AMR (N = 236; 0.3EAS (N = 495; 0.7%), EUR (N = 60,493; 79.7%), SAS (N = 7,034; 9.3%), Unassigned (N = 5,724; 7.5%).
Characteristics across rare disease participants by ancestry¶
| Phenotypes‡ | AFR (N = 1485; 2.4%) |
AMR (N = 203; 0.3%) |
EAS (N = 382; 0.6%) |
EUR (N = 48,295; 77.8%) |
SAS (N = 6,531; 10.5%) |
Unassigned (N = 5,160; 8.3%) |
|---|---|---|---|---|---|---|
| Age (Min – Max) | 40 (27; 1-98) | 38 (34; 1-78) | 41 (20; 0-91) | 39 (28;0-100) | 36 (29;0-89) | 33 (35; 0-96) |
| Sex (M / F, %) | 46.8 / 53.2 | 44.8 / 55.2 | 44.8 / 55.2 | 47.1 / 52.9 | 50.5 / 49.5 | 51.4 / 48.6 |
| Socio-economic status | ||||||
| Deprivation (%) | ||||||
| Lowest | 21.0 | 9.8 | 10.9 | 9.1 | 24.8 | 15.7 |
| Lower middle | 59.5 | 48.4 | 46.9 | 38.4 | 51.1 | 48.5 |
| Upper middle | 16.1 | 32.0 | 31.8 | 41.3 | 20.3 | 29.3 |
| Highest | 3.4 | 9.8 | 10.5 | 11.2 | 3.8 | 6.4 |
| Index of Multiple Deprivation (Rank) | 32.5 (22.2) | 19.9 (24.3) | 20.2 (24.7) | 16.3 (19.2) | 30.0 (27.1) | 24.1 (26.1) |
| Population structure | ||||||
| Ethnicity (%) | ||||||
| Asian | 0.2 | 0.0 | 74.1 | 0.0 | 79.5 | 11.8 |
| Black | 75.3 | 0.5 | 0.0 | 0.0 | 0.4 | 6.2 |
| White | 2.5 | 42.4 | 2.1 | 85.4 | 0.8 | 35.0 |
| Mixed | 4.9 | 13.8 | 1.8 | 0.4 | 1.1 | 18.1 |
| Not stated | 15.9 | 17.7 | 12.6 | 13.8 | 17.0 | 17.8 |
| Other | 1.2 | 25.6 | 9.4 | 0.4 | 1.3 | 11.1 |
| Consanguinity (%) | ||||||
| No | 48.0 | 46.3 | 40.6 | 42.6 | 21.8 | 42.5 |
| Possible | 0.3 | 0.0 | 0.3 | 0.1 | 0.9 | 0.5 |
| Yes | 0.5 | 2.0 | 1.0 | 0.4 | 16.2 | 6.6 |
| Unknown | 51.2 | 51.7 | 58.1 | 57.0 | 61.1 | 50.4 |
| Family structure (%) | ||||||
| Singleton | 29.0 | 19.2 | 29.6 | 19.5 | 13.8 | 18.9 |
| Duo | 20.8 | 13.3 | 9.7 | 13.8 | 11.0 | 14.2 |
| Trio | 35.4 | 56.7 | 47.6 | 49.1 | 50.6 | 47.7 |
| Other | 14.9 | 10.8 | 13.1 | 17.6 | 24.6 | 19.1 |
| Sample source (%) | ||||||
| Blood | 99.8 | 100.0 | 99.7 | 99.6 | 99.7 | 99.5 |
| Fibroblast | 0.1 | 0.0 | 0.0 | 0.0 | 0.1 | 0.1 |
| Saliva | 0.1 | 0.0 | 0.0 | 0.4 | 0.2 | 0.3 |
| Tissue | 0.1 | 0.0 | 0.3 | 0.0 | 0.0 | 0.0 |
| Sequencing quality† | ||||||
| Callability (%) | 95.2 (0.64) | 95.22 (0.65) | 95.2 (0.68) | 95.27 (0.66) | 95.3 (0.65) | 95.31 (0.66) |
| Array concordance (%) | 99.95 (0.0001) | 99.96 (0.0001) | 99.96 (0.01) | 99.96 (0.01) | 99.96 (0.0001) | 99.96 (0.0001) |
| Contamination | 0.0035 (0.001) | 0.0031 (0.001) | 0.0035 (0.001) | 0.003 (0.001) | 0.0032 (0.001) | 0.0031 (0.001) |
| Sequencing coverage | ||||||
| All chromosomes | 39.5 (7.6) | 39.1 (7.2) | 39.3 (7.9) | 39.2 (8.0) | 39.5 (8.4) | 39.1 (8.0) |
| Autosomal chromosomes | 40.0 (7.8) | 39.6 (7.0) | 39.9 (8.3) | 39.7 (8.2) | 40.1 (8.5) | 39.7 (8.1) |
| Mapping Quality (%) | ||||||
| Percent MAPQ 10 reads | 89.18 (1.37) | 89.42 (1.37) | 89.27 (1.26) | 89.34 (1.25) | 89.29 (1.29) | 89.30 (1.31) |
| Autosome Coverage at 15X | 96.03 (0.35) | 96.06 (0.34) | 96.03 (0.365) | 96.07 (0.37) | 96.08 (0.37) | 96.06 (0.36) |
| Average base call quality | 36.7 (0.9) | 36.7 (0.9) | 36.6 (1.0) | 36.7 (0.9) | 36.7 (1.0) | 36.7 (1.0) |
| Percent aligned reads (%) | 93.7 (1.35) | 93.7 (1.28) | 93.6 (1.31) | 93.7 (1.27) | 93.7 (1.28) | 93.7 (1.29) |
| Percent Q30 bases (%) | 84.12 (3.28) | 84.14 (2.87) | 83.93 (3.26) | 84.09 (3.25) | 84.00 (3.36) | 83.99 (3.39) |
| Sample error rate (%) | 0.0100 (0.0019) | 0.0097 (0.0017) | 0.0099 (0.0019) | 0.0097 (0.0018) | 0.0097 (0.0018) | 0.0097 (0.0018) |
| Mismatch rate (%) | 0.76 (0.17) | 0.76 (0.16) | 0.75 (0.17) | 0.75 (0.16) | 0.75 (0.17) | 0.75 (0.17) |
| Fragment length median | 483 (33) | 485 (39) | 481 (35) | 483 (34) | 483 (33) | 483 (34) |
| Genotype | ||||||
| Number of variants | ||||||
| TIER 1 | 0 (0) | 0 (0) | 0 (1) | 0 (0) | 0 (0) | 0 (0) |
| TIER 2 | 1 (4) | 1 (2) | 1 (2) | 0 (2) | 1 (3) | 1 (3) |
| TIER 3 | 243 (379) | 95 (281) | 240 (345) | 118 (226) | 73 (329) | 131 (282) |
| Indel (per 10000) | 118.1 (3.3) | 100.0 (3.6) | 98.2 (2.2) | 97.5 (2.3) | 99 (3.0) | 99.7 (4.9) |
| SNV (per 10000) | 473.7 (3.3) | 401.3 (3.6) | 393.5 (2.2) | 391.6 (2.3) | 398.1 (3.0) | 398.7 (4.9) |
| Indel + SNV (per 10000) | 592.2 (9.8) | 501.2 (13.9) | 491.7 (4.9) | 489.1 (5.2) | 497.4 (10.4) | 498.2 (19.6) |
| Transition/transversion ratio | 2.065 (0.003) | 2.062 (0.0035) | 2.056 (0.003) | 2.061 (0.003) | 2.060 (0.004) | 2.062 (0.004) |
| Indel Het/Hom ratio | 2.91 (0.12) | 2.30 (0.15) | 1.84 (0.05) | 2.14 (0.04) | 2.16 (0.27) | 2.24 (0.27) |
| SNV Het/Hom ratio | 2.00 (0.09) | 1.68 (0.11) | 1.35 (0.03) | 1.58 (0.03) | 1.59 (0.17) | 1.65 (0.18) |
| Penetrance (Incomplete / complete, %) |
21.3 / 78.7 | 15.3 / 84.7 | 18.3 / 81.7 | 24.5 / 75.5 | 21.9 / 78.1 | 22.5 / 77.5 |
| Rare disease type distribution (% within ancestry group) |
||||||
| Cardiovascular disorders | 11.7 | 4.9 | 7.9 | 11.9 | 7.3 | 7.3 |
| Ciliopathies | 0.3 | 0.0 | 1.1 | 0.9 | 1.4 | 0.9 |
| Dermatological disorders | 2.4 | 0.0 | 0.5 | 0.9 | 2.3 | 1.3 |
| Dysmorphic and congenital abnormality syndromes | 1.3 | 0.0 | 1.6 | 1.6 | 1.5 | 2.2 |
| Endocrine disorders | 2.0 | 3.9 | 3.2 | 2.2 | 2.6 | 2.7 |
| Gastroenterological disorders | 0.1 | 0.0 | 0.0 | 0.3 | 0.4 | 0.4 |
| Growth disorders | 0.4 | 0.0 | 0.0 | 0.6 | 0.3 | 0.6 |
| Haematological and immunological disorders | 2.0 | 2.9 | 2.6 | 2.3 | 1.6 | 2.2 |
| Haematological disorders | 0.1 | 0.0 | 0.5 | 0.6 | 0.3 | 0.3 |
| Hearing and ear disorders | 1.6 | 1.9 | 3.7 | 1.9 | 3.4 | 3.2 |
| Metabolic disorders | 2.0 | 1.0 | 0.5 | 1.8 | 3.5 | 2.2 |
| Neurology and neurodevelopmental disorders | 33.4 | 43.7 | 31.7 | 40.8 | 39.0 | 42.0 |
| Ophthalmological disorders | 14.8 | 11.7 | 12.7 | 7.5 | 13.4 | 9.4 |
| Psychiatric disorders | 0.5 | 0.0 | 0.5 | 0.1 | 0.0 | 0.2 |
| Renal and urinary tract disorders | 18.1 | 12.6 | 24.3 | 9.7 | 10.2 | 12.5 |
| Respiratory disorders | 0.3 | 1.0 | 0.0 | 1.1 | 0.4 | 0.8 |
| Rheumatological disorders | 0.5 | 1.0 | 0.5 | 0.8 | 0.4 | 0.9 |
| Skeletal disorders | 1.8 | 4.9 | 0.0 | 2.5 | 2.1 | 2.5 |
| Tumour syndromes | 2.8 | 3.9 | 3.2 | 5.4 | 1.6 | 2.3 |
| Ultra-rare disorders | 2.5 | 5.8 | 3.7 | 5.4 | 6.1 | 4.6 |
| Multi | 1.5 | 1.0 | 1.6 | 1.6 | 1.8 | 1.4 |
| Other disorders | 0.0 | 0.0 | 0.0 | 0.2 | 0.1 | 0.0 |
| Outcome | ||||||
| Case solved (Proband, %) | ||||||
| Yes | 10.0 | 8.9 | 11.3 | 7.9 | 9.7 | 10.5 |
| No | 3.6 | 3.9 | 3.4 | 2.4 | 2.5 | 2.8 |
| Unknown | 86.4 | 87.2 | 85.3 | 89.8 | 87.8 | 86.7 |
AFR, African ancestry; AMR, Admixed American ancestry; EAS, East Asian ancestry, EUR; European ancestry; SAS, South Asian ancestry.
‡Median (IQR) for the continuous variables. Median (IQR, min-max) for age. † Sample sizes for sequencing quality metrics are different from those stated in the top panel as these cover blood samples only; AFR (N = 1,482; 2.4%), AMR (N = 203; 0.3%), EAS (N = 381; 0.6%), EUR (N = 48,085; 77.8%), SAS (N = 6,511; 10.5%), Unassigned (N = 5,136; 8.3%).
Characteristics across cancer participants by ancestry†¶
| Phenotypes | AFR (N = 482; 3.3%) |
AMR (N = 35; 0.2%) |
EAS (N = 123; 0.8%) |
EUR (N = 12,984; 87.8%) |
SAS (N = 546; 3.7%) |
Unassigned (N = 623; 4.2%) |
|---|---|---|---|---|---|---|
| Age (Min – Max) | 59 (18; 1 - 98) |
48 (10; 1 - 78) |
56 (20; 0 - 91) |
67 (18; 0 - 100) |
57 (22; 0 - 89) |
60 (24; 0 - 96) |
| Sex (M / F, %) | 43.8 / 56.2 | 31.4 / 68.6 | 27.6 / 72.4 | 44.1 / 55.9 | 41.0 / 59.0 | 42.2 / 57.8 |
| Socio-economic status | ||||||
| Deprivation (%) | ||||||
| Lowest | 16.7 | 5.6 | 10.3 | 7.2 | 18.0 | 12.8 |
| Lower middle | 66.7 | 72.2 | 48.5 | 37.2 | 46.7 | 44.3 |
| Upper middle | 14.7 | 0.0 | 35.3 | 44.0 | 27.8 | 33.2 |
| Highest | 2.0 | 22.2 | 5.9 | 11.7 | 7.6 | 9.7 |
| Index of Multiple Deprivation (Rank) | 32.0 (18.7) | 22.8 (14.0) | 21.7 (24.7) | 15.2 (17.6) | 24.6 (26.4) | 20.9 (22.9) |
| Population structure | ||||||
| Ethnicity (%) | ||||||
| Asian | 0.6 | 0.0 | 54.5 | 0.0 | 66.8 | 5.6 |
| Black | 67.8 | 0.0 | 0.0 | 0.0 | 0.5 | 4.8 |
| White | 4.1 | 28.6 | 3.3 | 79.2 | 2.2 | 49.8 |
| Mixed | 3.7 | 14.3 | 2.4 | 0.1 | 1.5 | 9.5 |
| Not known | 2.1 | 8.6 | 1.6 | 4.2 | 7.1 | 3.5 |
| Not stated | 19.7 | 11.4 | 19.5 | 16.0 | 16.8 | 19.6 |
| Other | 1.9 | 37.1 | 18.7 | 0.4 | 4.9 | 7.2 |
| Consanguinity (%) | ||||||
| Unknown | 100 | 100 | 100 | 100 | 100 | 100 |
| Family structure (%) | ||||||
| Other | 100 | 100 | 100 | 100 | 100 | 100 |
| Sample source (%) | ||||||
| Blood | 96.9 | 94.3 | 92.7 | 95.6 | 95.8 | 94.4 |
| Fibroblast | 0.0 | 0.0 | 0.8 | 0.3 | 0.2 | 0.2 |
| Germline | 0.0 | 0.0 | 0.0 | 0.2 | 0.2 | 0.2 |
| Saliva | 2.5 | 2.9 | 3.3 | 3.4 | 2.2 | 3 |
| Tissue | 0.6 | 2.9 | 3.3 | 0.5 | 1.6 | 2.2 |
| Sequencing quality†† | ||||||
| Callability (%) | 95.23 (0.66) | 94.98 (0.65) | 95.10 (0.63) | 95.28 (0.68) | 95.20 (0.67) | 95.22 (0.67) |
| Array concordance (%) | 99.95 (0.0001) | 99.96 (0.01) | 99.96 (0.0001) | 99.96 (0.01) | 99.96 (0.0001) | 99.96 (0.01) |
| Contamination | 0.0029 (0.004) | 0.0032 (0.004) | 0.0024 (0.004) | 0.0026 (0.003) | 0.003 (0.004) | 0.0025 (0.003) |
| Sequencing coverage | ||||||
| All chromosomes | 38.79 (8.38) | 37.45 (3.73) | 38.31 (8.67) | 38.65 (9.96) | 38.8 (10.19) | 38.79 (8.38) |
| Autosomal chromosomes | 39.06 (8.52) | 37.62 (4.48) | 38.785 (8.47) | 39.1 (9.99) | 39.37 (10.62) | 39.06 (8.52) |
| Mapping Quality (%) | ||||||
| Percent MAPQ 10 reads | 89.27122917 (1.782) | 88.917761 (1.585) | 89.47939067 (1.676) | 89.34424062 (1.761) | 89.27198333 (1.565) | 89.37981845 (1.822) |
| Autosome Coverage at 15X | 96.04 (0.36) | 95.93 (0.34) | 96.035 (0.387) | 96.07 (0.4) | 96.07 (0.41) | 96.075 (0.392) |
| Average base call quality | 36.8 (1.25) | 36.4 (1.1) | 36.7 (1.175) | 36.7 (1.2) | 36.8 (1.1) | 36.7 (1.2) |
| Percent aligned reads (%) | 93.83 (2.115) | 93.49 (1.84) | 93.84 (1.92) | 93.7 (1.96) | 93.6 (1.625) | 93.765 (1.965) |
| Percent Q30 bases (%) | 84.61 (4.835) | 83.35 (3.92) | 84.165 (4.255) | 84.28 (4.78) | 84.35 (4.17) | 84.15 (4.585) |
| Sample error rate (%) | 0.0098 (0.002) | 0.0102 (0.002) | 0.0096 (0.002) | 0.0095 (0.002) | 0.0095 (0.002) | 0.0096 (0.002) |
| Mismatch rate (%) | 0.77 (0.185) | 0.79 (0.2) | 0.745 (0.2) | 0.75 (0.2) | 0.74 (0.165) | 0.76 (0.202) |
| Fragment length median | 481 (28) | 483 (16) | 486 (23.75) | 481 (32) | 482 (29) | 481 (33) |
| Genotype | ||||||
| Number of variants | ||||||
| TIER 1* | 0 (0) | 0 (1) | 0 (1) | 0 (1) | 0 (1) | 0 (1) |
| TIER 3* | 7 (4) | 3 (2) | 3 (3) | 2 (2) | 3 (2) | 3 (2) |
| Domain 1** | 2 (3) | 2 (2) | 2 (3) | 3 (4) | 2 (3) | 2 (3) |
| Domain 2** | 4 (5) | 4 (6) | 4 (5) | 5 (6) | 4 (4) | 4 (5) |
| Domain 3** | 103 (94) | 80 (50.5) | 102 (100) | 107 (120) | 90 (91) | 92 (98) |
| Indel (per 10000) * | 117.9 (3.3) | 99.9 (4.4) | 98.4 (3.2) | 97.7 (2.9) | 99.9 (2.8) | 100.0 (5.5) |
| SNV (per 10000) * | 473.4 (7.6) | 399.8 (15.2) | 394.6 (3.4) | 391.7 (3.8) | 400.6 (4.6) | 398.2 (13.6) |
| Indel + SNV (per 10000) * | 591.8 (10.2) | 499.6 (16.6) | 493.2 (5.7) | 489.6 (5.2) | 500.6 (6.4) | 498.1 (18.9) |
| Transition/transversion ratio* | 2.065 (0.003) | 2.061 (0.004) | 2.057 (0.004) | 2.062 (0.004) | 2.060 (0.004) | 2.063 (0.004) |
| Indel Het/Hom ratio* | 2.93 (0.13) | 2.25 (0.29) | 1.85 (0.05) | 2.14 (0.05) | 2.20 (0.08) | 2.25 (0.26) |
| SNP Het/Hom ratio* | 2.02 (0.09) | 1.66 (0.19) | 1.35 (0.03) | 1.58 (0.03) | 1.62 (0.06) | 1.64 (0.16) |
| Cancer type distribution | ||||||
| Glioma | 0.8 | 0.0 | 4.1 | 4.1 | 4.0 | 4.3 |
| Bladder | 2.3 | 0.0 | 0.8 | 2.8 | 2.0 | 2.3 |
| Breast | 29.9 | 34.3 | 30.9 | 18.9 | 23.3 | 21.5 |
| Colorectal | 13.1 | 2.9 | 17.1 | 18 | 17.1 | 13.8 |
| Endometrial | 7.1 | 5.7 | 5.7 | 5.4 | 7.9 | 4.7 |
| Haematological | 4.2 | 5.7 | 8.9 | 5.3 | 6.4 | 5.9 |
| Hepatopancreatobiliary | 1.0 | 0.0 | 0.8 | 2.3 | 0.6 | 1.1 |
| Lung | 5.2 | 0.0 | 7.3 | 10.8 | 4 | 9.3 |
| Oral | 0.6 | 0.0 | 0.8 | 1.7 | 3.1 | 1.0 |
| Ovarian | 2.7 | 5.7 | 4.1 | 4.1 | 5.1 | 5.1 |
| Prostate | 17.0 | 2.9 | 2.4 | 3.3 | 2.2 | 4.0 |
| Renal | 6.4 | 22.9 | 4.1 | 9.3 | 9.9 | 8.0 |
| Sarcoma | 6.2 | 11.4 | 9.8 | 7.3 | 10.5 | 10.9 |
| Other | 3.3 | 8.6 | 2.4 | 6.5 | 3.9 | 7.9 |
| Multiple cancer | 0.0 | 0.0 | 0.8 | 0.1 | 0.0 | 0.0 |
AFR, African ancestry; AMR, Admixed American ancestry; EAS, East Asian ancestry, EUR; European ancestry; SAS, South Asian ancestry.
† These data represent a snapshot of the 100kGP and may not be fully representative of the general population. A previous analysis investigated how representative the 100kGP cancer programme is in terms of cancer rates for different ethnicities in England (recorded by Public Health England).
†† Sample sizes for sequencing quality metrics are different from those stated in the top panel as these cover blood samples only; AFR (N = 467; 3.3%), AMR (N = 33; 0.2%), EAS (N = 114; 0.8%), EUR (N = 12,408; 87.8%), SAS (N = 523; 3.7%), Unassigned (N = 588; 4.2%). Bonferroni corrected P-value threshold for sequencing quality-related metrics = 0.0036 (0.05/14).
*Germline variants. **Somatic variants. ‡Median (IQR) for the continuous variables. Median (IQR, min-max) for age
Definition of phenotypes¶
| Phenotypes | Definition |
|---|---|
| Ancestral group | Individuals were classified into five genetically inferred ancestry groups (AFR / AMR / EAS / EUR / SAS) based on probabilities (> 0.8) derived from PC scores (PC 1-8). Detailed methods for ancestry inference can be found here. Individuals who didn’t meet the criteria for ancestral classification were grouped into an “Unassigned” group. |
| Age | = Year that the DNA is sequenced – Year of birth |
| Sex | Sex (male, female) was defined using a combination of self-report and genotype data. Males were defined as individuals who identify themselves as male and have "XY", "XXY", or "XYY" chromosomes. Females were defined as individuals who identify themselves as female and have "XX", "X0", or "XXX" chromosomes. Participants with mismatched self-reported and genotype sex traits were treated as missing and excluded from the analysis. Patients who reported themselves to be indeterminate sex were also excluded. |
| Socio-economic status | |
| Deprivation group | Individuals were categorised into four different deprivation groups based on Index of Multiple Deprivation (IMD) decile as follows: Lowest = Most deprived 10%; Lower middle = More deprived 10-50%; Upper middle = Less deprived 10-50%; Highest = Least deprived 10% |
| Index of Multiple Deprivation | MDI index (rank) at the time of registration. Higher index indicates more deprivation. |
| Population structure | |
| Ethnicity | Individuals were grouped into “Asian”, “Black”, “White”, “Mixed”, “Others”, “Unknown” and “Not stated” based on a self-reported questionnaire for ethnicity (the 16+1 ethnic data categories defined in the 2001 census). |
| Consanguinity* | This indicates a consanguineous relationship (No / Possible / Yes / Unknown). Consanguinity was defined based on runs of homozygosity from the whole genome SNV variant call set. Missingness in this variable was treated as "Unknown". |
| Family structure* | Type of family enrolled in the study (Singleton, Trio, Duo, Other). “Other” includes duos and trios with relatives other than their biological mother; or father or families with more than three members. |
| Sample source | From “aggregate_gvcf_sample_stats” table. |
| Sample source | Type of sample: Blood, Fibroblast, Saliva, Tissue or Germline |
| Sequencing quality† | From “aggregate_gvcf_sample_stats” table. Germline variants only. |
| Flow cell version | Version of the flow cell used for the sequencing process. |
| Callability | Callability is defined as the fraction of non-N reference positions having a passing genotype call. |
| Array concordance | Concordance rate is the proportion of matching genotype array calls to all non-missing variant sequencing calls. |
| Contamination | The proportion of a sample that is contaminated with sequence from other humans is calculated using VerifyBAMID (with the parameter FREEMIX). Only participants with a contamination rate of less than 3% were included in the AggV2 data after quality control. |
| Sequencing coverage | Mean sequencing coverage across all chromosomes and across autosomes only. Coverage is defined as the total number of aligned bases divided by the genome size. |
| Mapping Quality | Percentage of reads with a map quality score (MAPQ) >=10 as a proportion of total pass-filter (PF) reads. Mean coverage of MAPQ >= 10 reads at 15x. |
| Average base call quality | Average quality of the base calls. A ratio of the sum of base qualities to total length (Scaled to Phred). |
| Percent aligned reads | Percentage of reads aligned to the reference genome. |
| Percent Q30 bases | The total number of bases with a base quality ≥ 30. |
| Sample error rate | Sequencing error rate calculated using Samtools. Error rate refers to ratio of mismatches to bases mapped (cigar) = N mismatches (from the NM auxiliary tag) / N aligned bases. |
| Mismatch rate | The average percentage of mismatches across reads 1 and 2 over all cycles. |
| Fragment length median | Median length of sequenced fragments. The fragment length is calculated based on the locations at which a read pair aligns to the reference. |
| Genotype | |
| Number of tiered and domain variants | The total number of variants in each tier (1, 2, and 3 for rare disease patients; 1 and 3 for cancer patients) or in each domain (1, 2, and 3). |
| Indel | Total number of indels (germline) |
| SNV | Total number of SNVs (germline) |
| Indel + SNV | Indel + SNV (germline) |
| Transition/transversion ratio | Transition to transversion ratio (germline) |
| Indel Het/Hom ratio | Heterozygote / homozygote ratio for indels (germline) |
| Outcome | |
| Penetrance* | Defined by the referring clinician at the genetic test ordering stage. “Complete” indicates that the condition is thought to be penetrant, or the pedigree shows potential penetrance. “Incomplete” indicates that penetrance could be complete or incomplete. Singletons (proband-only) are classified as “complete”. |
| Rare disease type distribution* | Percentage distribution of patients diagnosed with each type of rare disease within each ancestry group. |
| Cancer type distribution** | Percentage distribution of patients diagnosed with each type of cancer within each ancestry group. |
| Case solved* | Percentage of participants (probands) whose cases were partially / fully explained by any of the tiered variants. Yes = The variants explained the cases (yes / partially) No = No Unknown = marked as NA or no data recorded for case resolution. |
*Rare disease patients only. **Cancer patients only. † Blood samples only.
References¶
- Zhang, F. et al. Ancestry-agnostic estimation of DNA sample contamination from sequence reads. Genome Res 30, 185–194 (2020).