De novo data cohort statistics
Trio breakdown
The table below shows the number of families, trios (including nested trios), families with nested trios, and participants within the DNV dataset for the 100kGP V9 Data Release for the GRCh37 and GRCh38 cohorts, as well as the combined cohort. As shown, the minority of families contain nested trios.
| Cohort Total | GRCh37 | GRCh38 | Total |
|---|---|---|---|
| Number of families (total) | 1,762 | 10,847 | 12,609 |
| Number of trios | 1,921 | 12,028 | 13,949 |
| Number of families (from row 1) with nested trios | 151 | 1,134 | 1,285 |
| Number of participants (total, across all families) | 5,447 | 33,732 | 39,179 |
Please note there are there 11 families that exist on both the GRCh37 and GRCh38 cohorts. Please take this into account when filtering the LabKey tables (use the column: assembly).
DNV breakdown
Number of DNVs per trio
The table below shows the distribution per trio of Mendelian inconsistencies, base_filter pass, and stringent_filter pass variants for the GRCh37, GRCh38, and combined cohorts. As is shown below, there is a small handful of trios that lie outside of the expected distribution (high rates of stringent_filter pass DNVs for example). It was found that 12 families did not have any base_filter or stringent_filter pass variants on chromosomes (1:22, X, M) in the GRCh38 cohort.
| >Metric / Cohort | Mendelian inconsistencies GRCh37 | Mendelian inconsistencies GRCh38 | Mendelian inconsistencies Combined | base_filter pass DNVs GRCh37 | base_filter pass DNVs GRCh38 | base_filter pass DNVs Combined | stringent_filter_pass DNVs GRCh37 | stringent_filter_pass DNVs GRCh38 | stringent_filter_pass DNVs Combined |
|---|---|---|---|---|---|---|---|---|---|
| Minimum | 3,603 | 28 | 28 | 706 | 0 | 0 | 32 | 0 | 0 |
| 1st Quartile | 5,057 | 5,461 | 5,397 | 1,170 | 771 | 790 | 59 | 61 | 61 |
| Median | 5,523 | 5,999 | 5,927 | 1,339 | 916 | 988 | 69 | 71 | 71 |
| Mean | 5,753 | 6,248 | 6,177 | 1,377 | 981 | 1,036 | 70 | 72 | 72 |
| 3rd Quartile | 6,045 | 6,547 | 6,501 | 1,538 | 1,186 | 1,245 | 79 | 81 | 81 |
| Maximum | 92,836 | 93,689 | 93,689 | 11,514 | 10,319 | 11,514 | 441 | 1,489 | 1,489 |
* Note that trios derived from families containing nested trios are not counted in the Mendelian inconsistencies.
Total Mendelian inconsistencies per trio
The below plot shows the distribution of total Mendelian inconsistencies per trio (trios derived from families containing nested trios are excluded) per cohort.
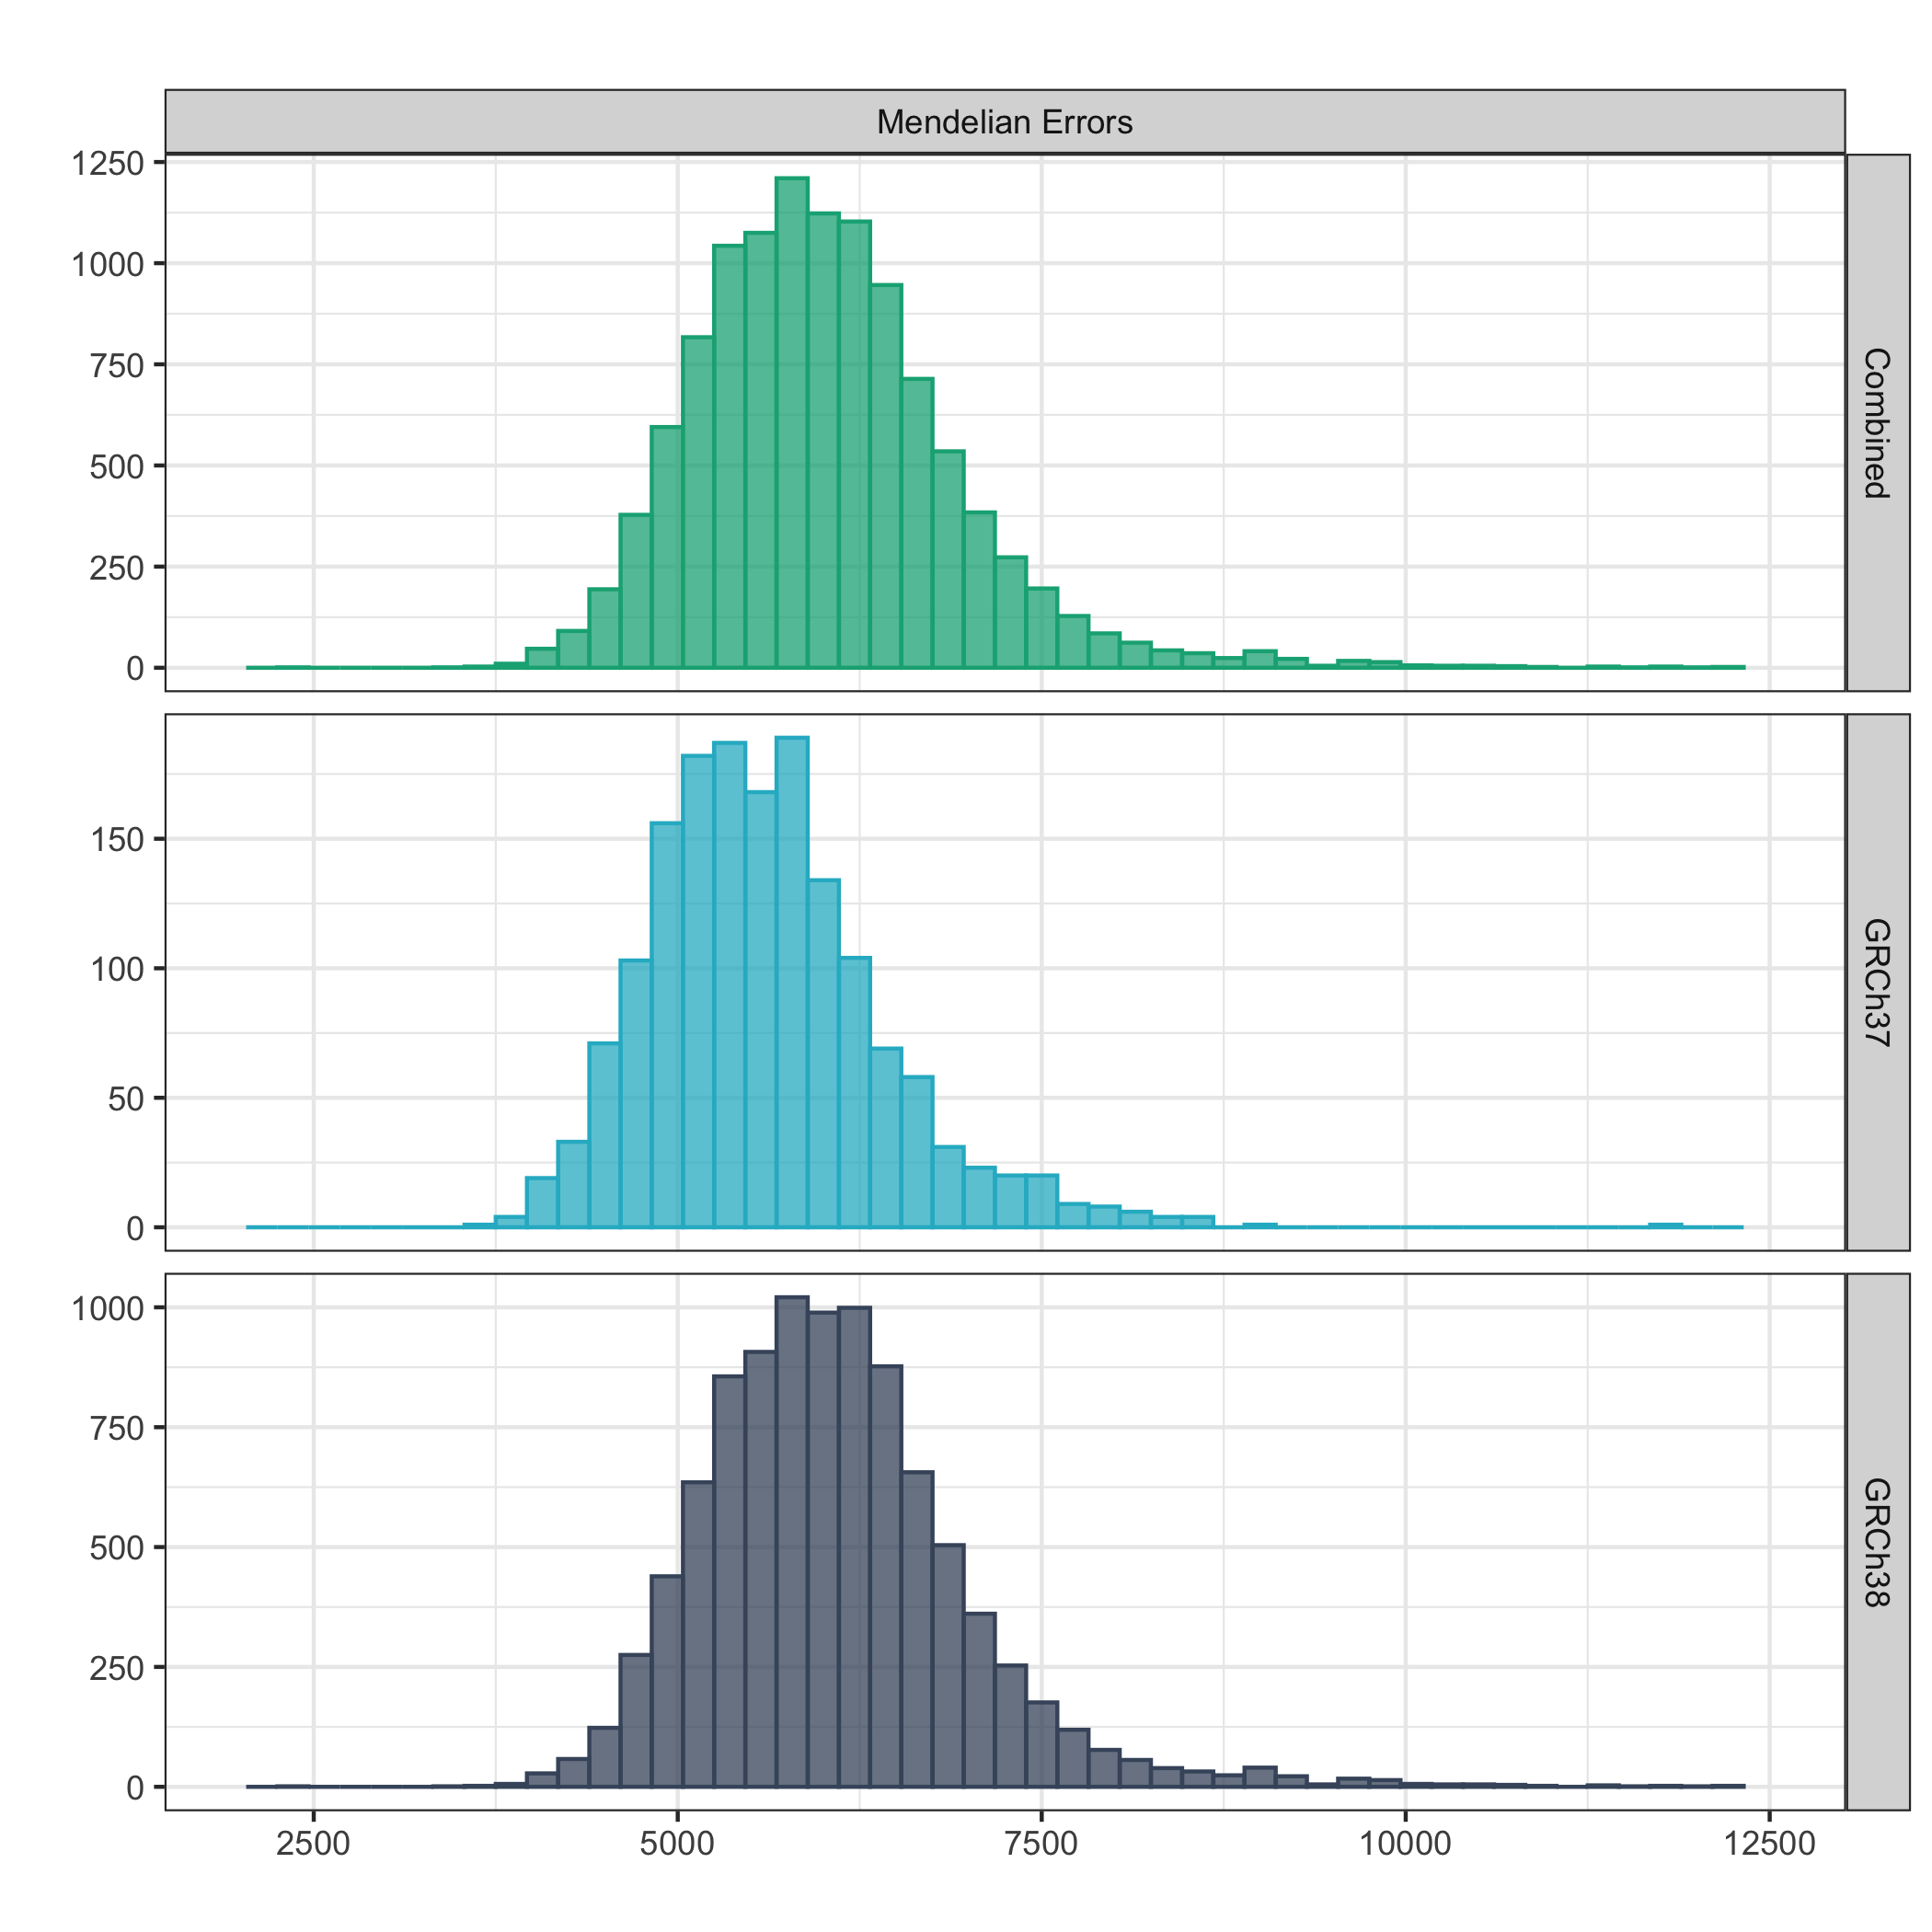
Values outside four standard deviations from the mean are not included in the plot.
Total base_filter pass DNVs per trio
The below plot shows the distribution of total base_filter pass variants per trio (all trios included). A bimodal distribution was observed (left panel) which upon further inspection was shown to be driven by the distribution of base_filter pass variants for males on the X-chromosome (middle-panel; showing the combined cohort). Additionally, it was observed that on average, more variants pass the base_filter in the GRCh37 cohort than the GRCh38 cohort (right panel; showing the combined cohort).
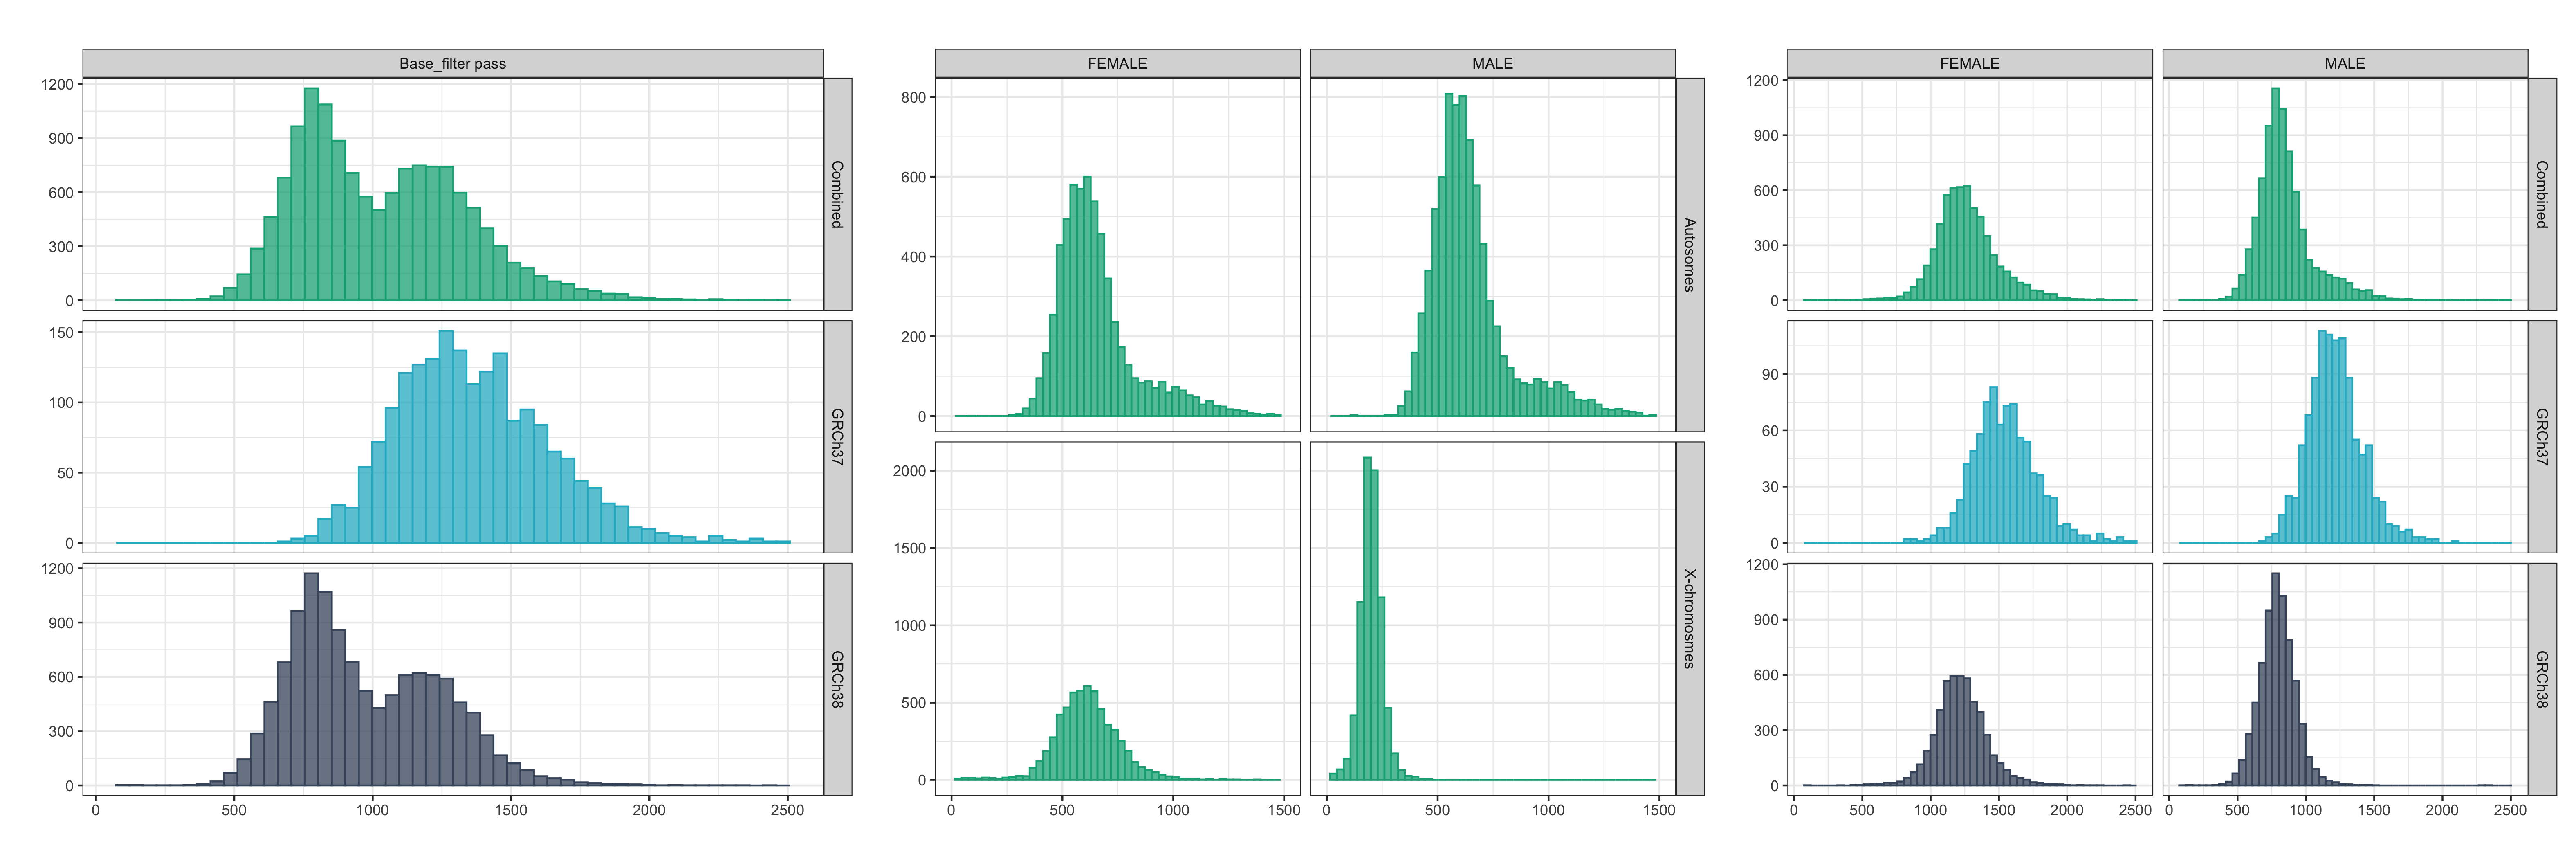
Values outside four standard deviations from the mean are excluded in the plot.
Total stringent_filter pass DNVs per trio
The below plot shows the distribution of total stringent_filter pass variants per trio (all trios included). After applying the stringent_filter (which includes flagging of problematic genomic regions; such as simple repeats and segmental duplications), a normal distribution of DNVs per trio was observed - centred around a mean of 72 and median of 71 stringent_filter pass DNVs per trio across both cohorts.
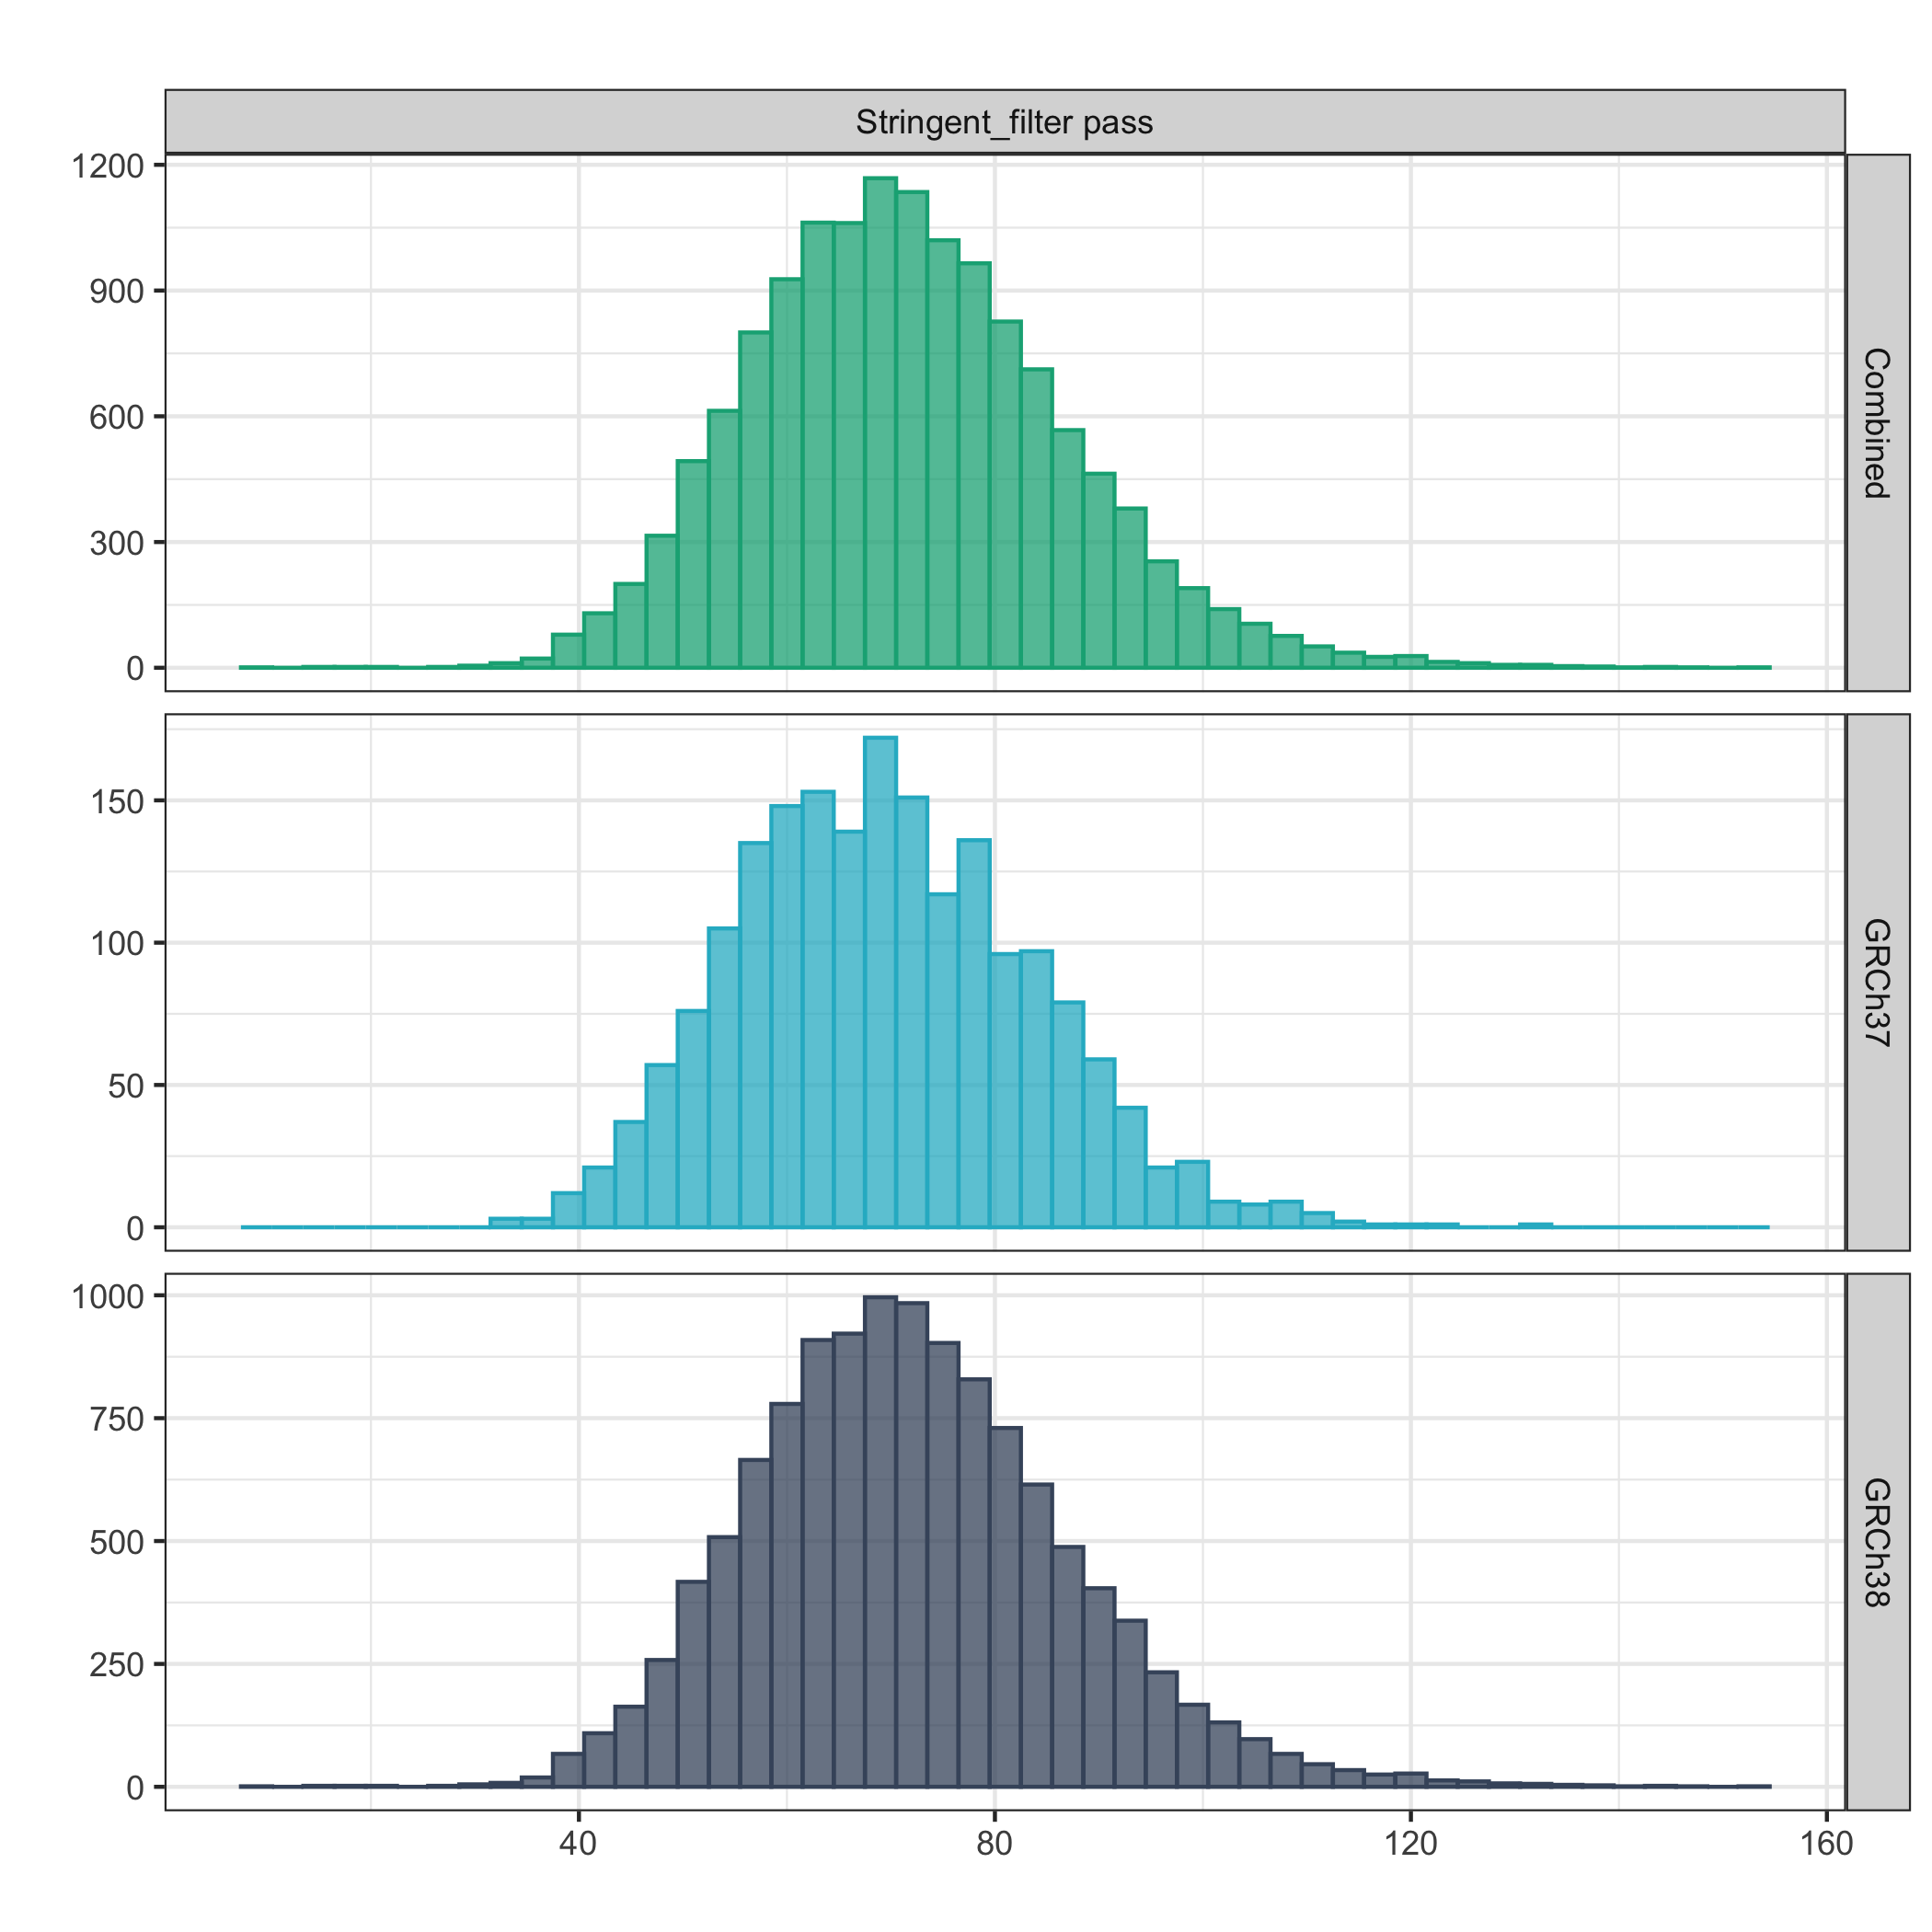
Values outside four standard deviations from the mean are not included in the plot.
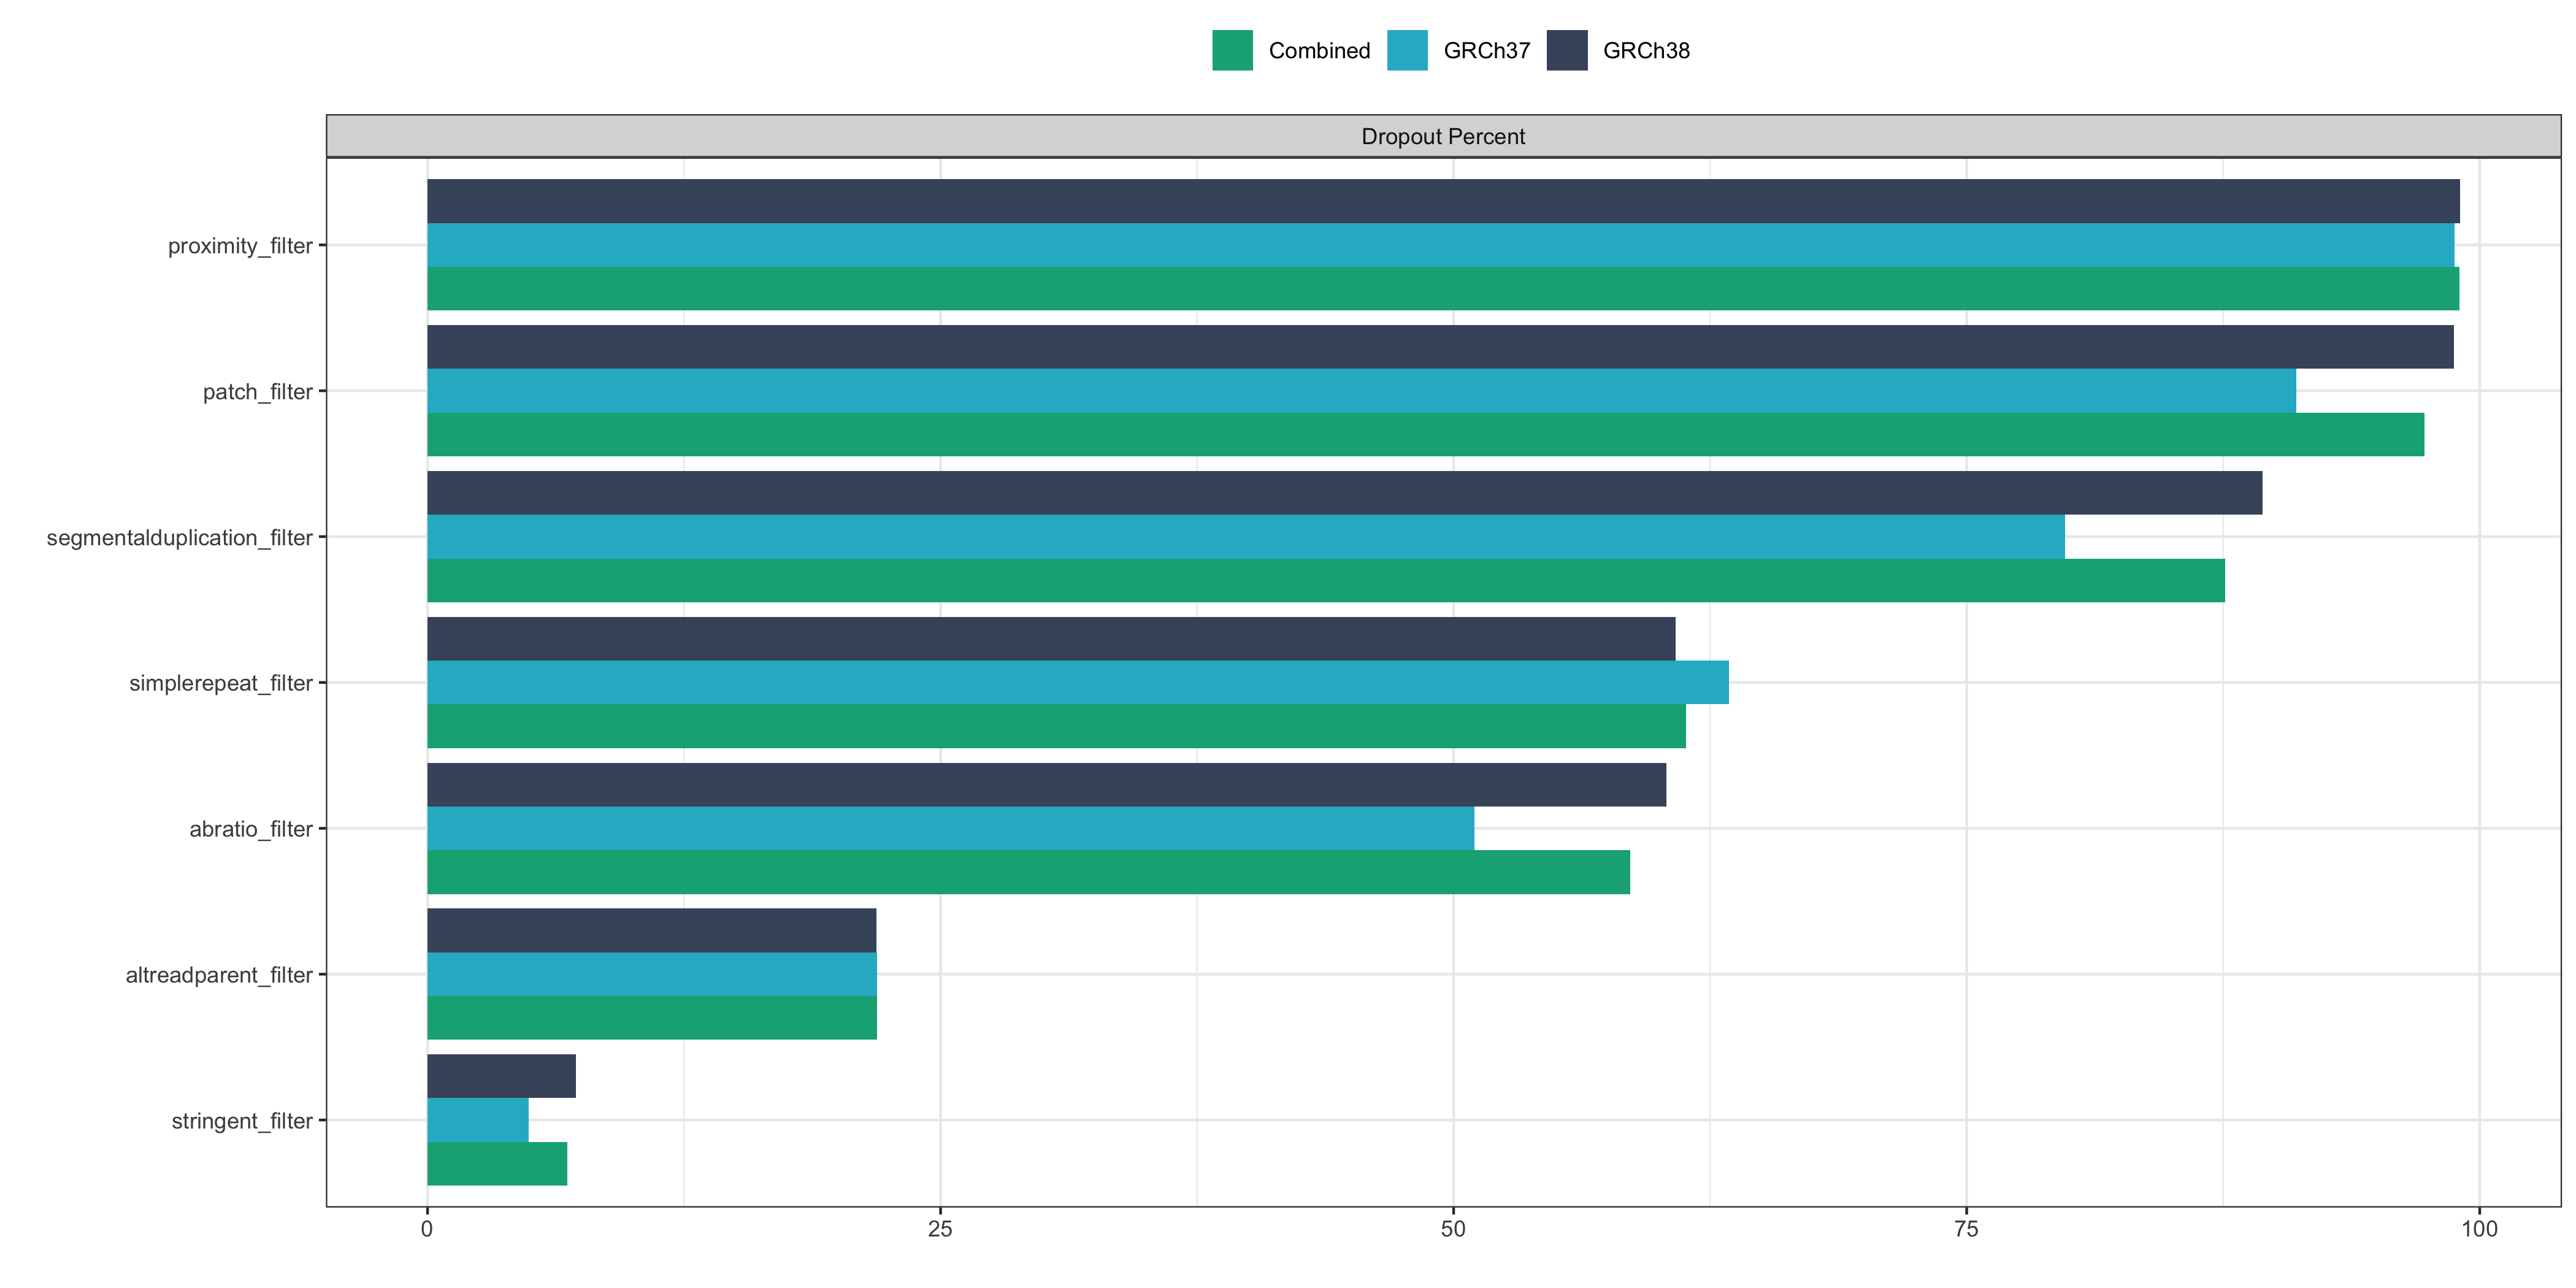
Dropout rate per stringent_filter
The plot below shows the percentage of base_filter pass variants that fail each of individual stringent filters.
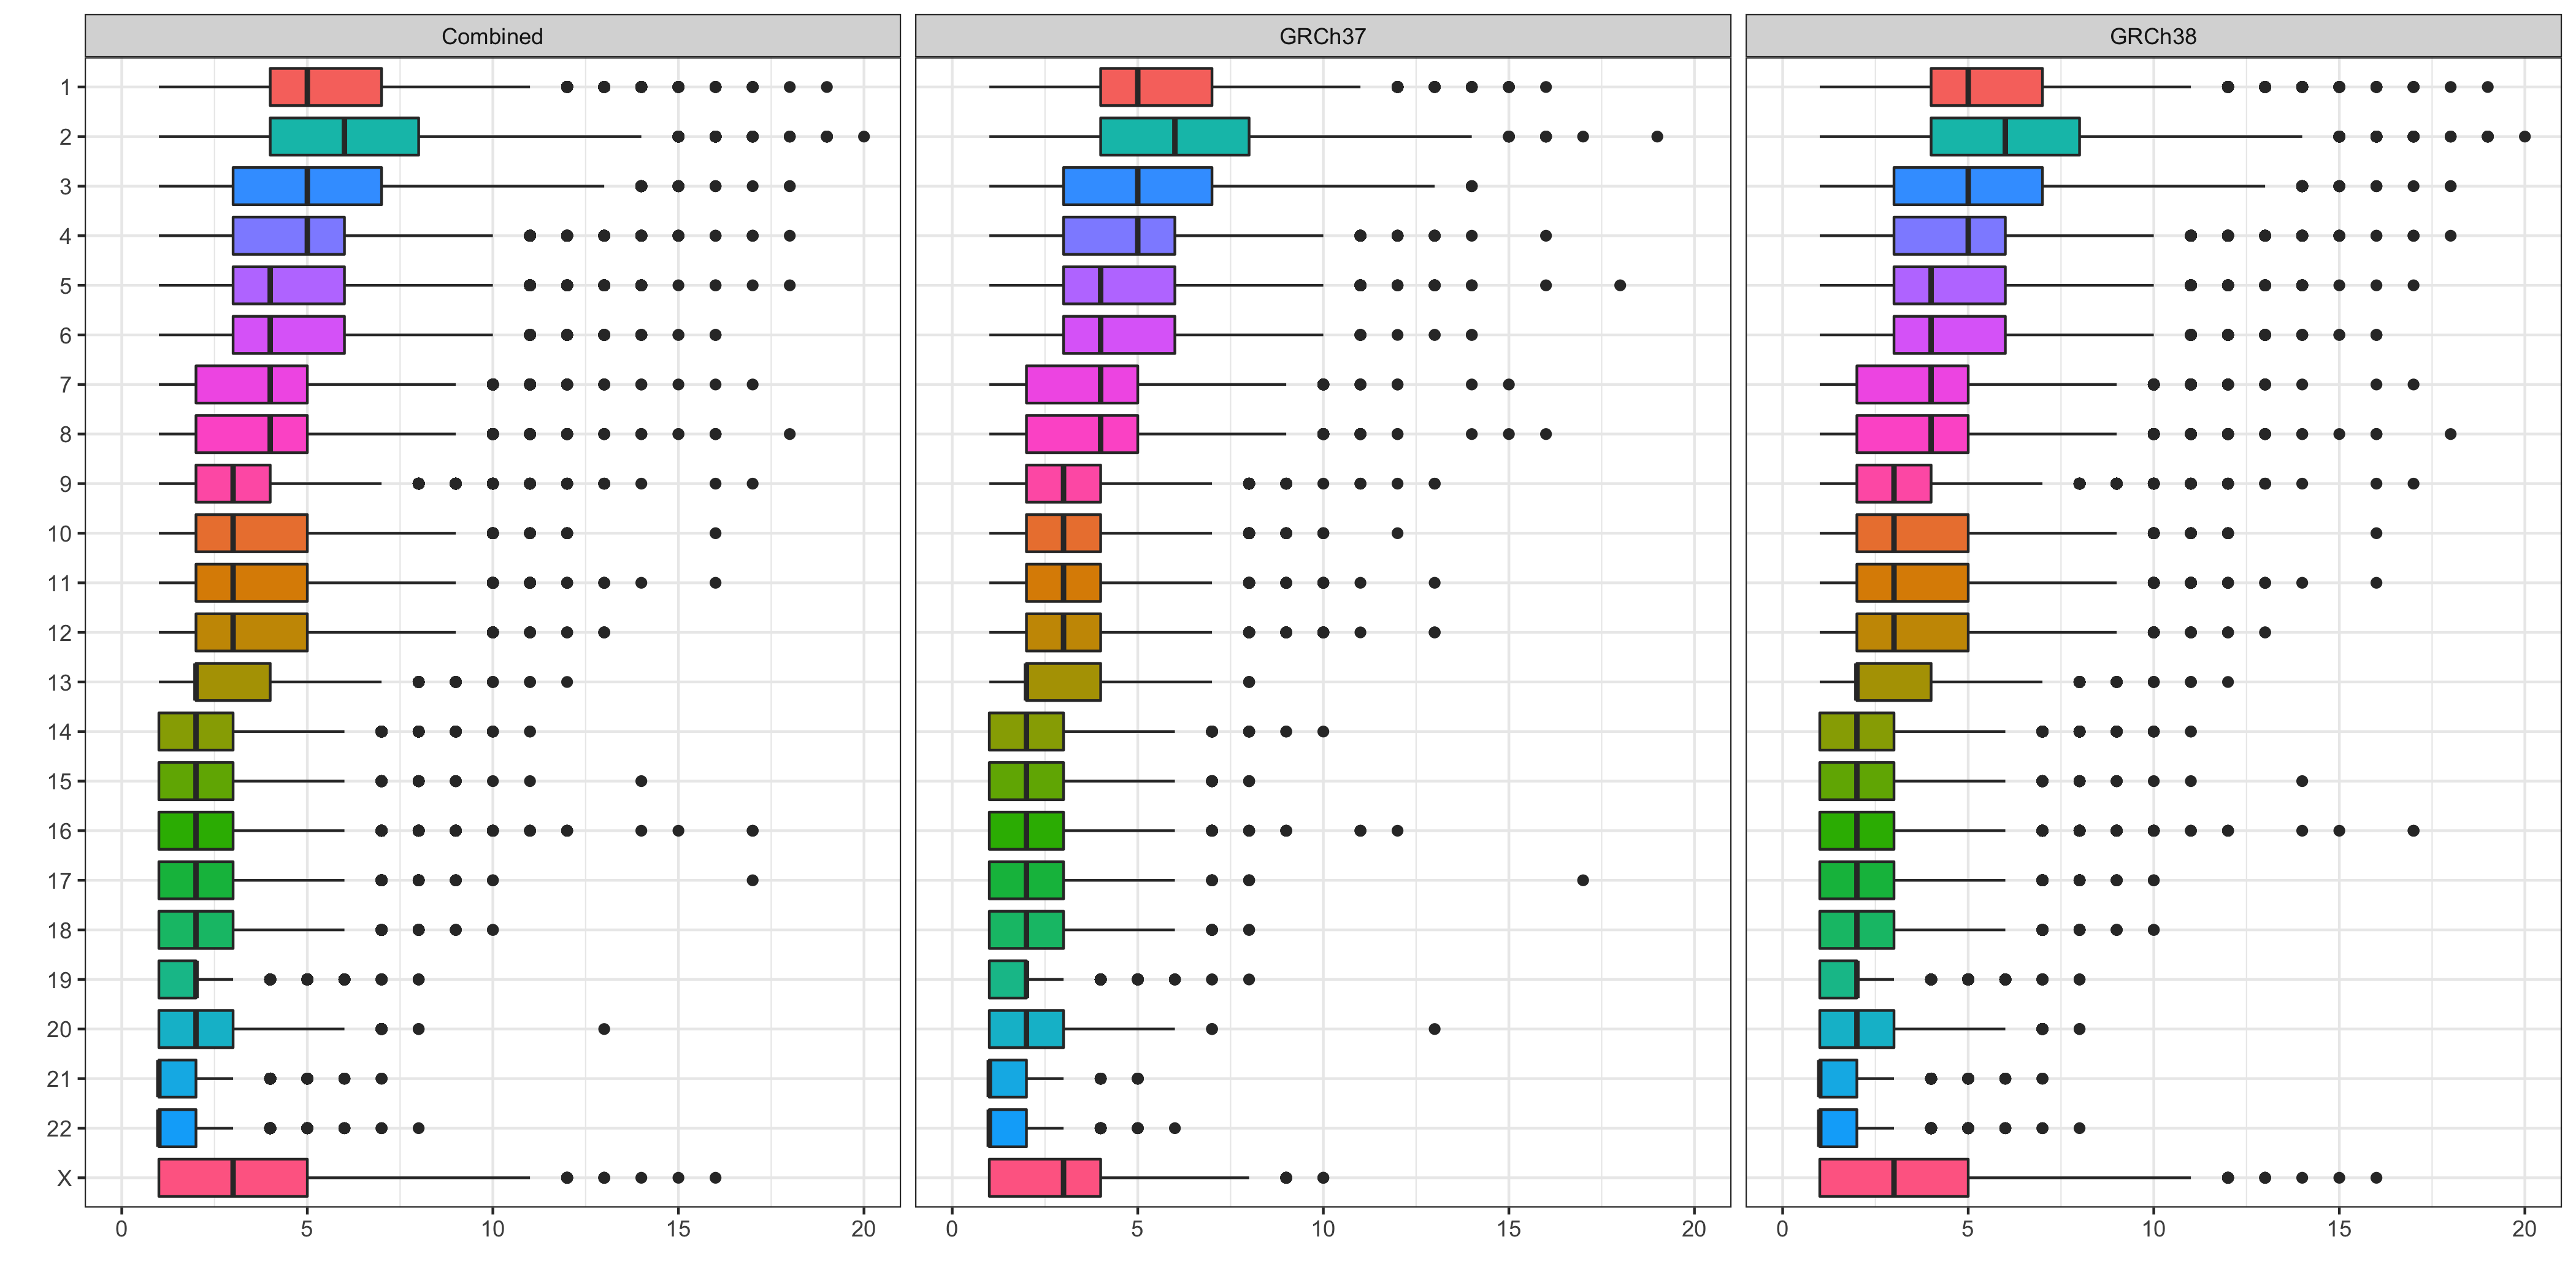
Distribution of stringent_filter pass DNVs by chromosome
The plot below shows the distribution of stringent_filter pass DNVs across chromosomes.