AggV2 allele frequencies
Allele frequencies (AFs) are calculated for all variant sites in AggV2, including for the whole group and for various subsets. These are included in indexed flatfiles and the functionally annotated VCFs.
We used samples from the 100kGP data release 12, listed at /gel_data_resources/main_programme/aggregation/aggregate_gVCF_strelka/aggV2/docs/main_programme_v12_samples.txt
AFs are provided as indexed flatfiles located at: /gel_data_resources/main_programme/aggregation/aggregate_gVCF_strelka/aggV2/additional_data/allele_frequencies/
or included within the VEP 109 annotated functional annotation data at: /gel_data_resources/main_programme/aggregation/aggregate_gVCF_strelka/aggV2/functional_annotation/VEP_109/
AFs are calculated as:
Due to the decomposed representation of multiallelic variants, take care in deriving the true allele number. For half missing genotypes resulting from multiallelic decomposition, both alleles are counted as alternate (assuming they have depth > 0) for the purposes of the allele number. See "Calculating AFs" for more details.
For more information on how to query the VCF data please see our aggV2 code book.
AFs provided
We provide multiple sets of AFs, using differing subsets of samples based on the total sample set of aggV2:
| Set | N samples | Sample description | Description |
|---|---|---|---|
| Whole cohort | 77,844 | All samples | This is your go-to column to identify if a variant is present at all in the cohort. |
| Unrelated cohort | 55,502 | All samples from the unrelated set | All samples contained within the unrelated cohort as defined here. |
| Unrelated by super population | 55,502 | Unrelated samples with assigned to the afr, eas, eur, or sas super-populations with a threshold >=0.8 | These allele frequencies are calculated using genetically inferred ancestries derived as described here. AFs for unassigned and amr samples were not calculated (hence the difference between the total number of samples in the unrelated set, and the sum of samples per super population). |
| Unrelated by super population | 1,558 | afr | as above |
| Unrelated by super population | 424 | eas | as above |
| Unrelated by super population | 45,458 | eur | as above |
| Unrelated by super population | 4,450 | sas | as above |
| Cancer | 15,146 | All cancer cohort samples | Allele frequencies for all cancer samples contained within aggV2. |
| Cancer unrelated | 14,841 | Unrelated samples from the cancer cohort | This set includes only unrelated samples from the cancer cohort germline samples. The cancer cohort is largely unrelated, hence the small difference in sample number between this and the cancer set. |
| RD | 62,698 | The whole RD cohort | This set includes all samples found in the rare disease cohort within aggV2. |
| RD probands | 29,602 | Probands recruited to the rare disease cohort | This set includes all probands from the rare disease cohort. Cryptic relationships may exist as related individuals have not been filtered out. |
Sample filtering was only conducted as described above, with no further filtering to separate based on sample features such as whether the sample originated from blood or saliva. For details on sample QC and filtering for the aggV2, please see here.
Allele frequency data are only provided for the autosomes and chr X
Format and location of files
Files are provided as flat text files, with the first six columns comprising the CHROM, POS, REF, ALT, OLD_CLUMPED and OLD_MULTIALLELIC lines from the functional annotation files. These are followed by AFs and associated information for each of the sets described above.
These are provided at file_path_to_AFs, as well as within the functional annotation files provided at file_path_to_func_ann.
The AF files contain the constituent values for an AF for each set. For example, for the afr super population, columns provided include the AC_afr, AN_afr, and AF_afr.
Calculating AFs
The allele frequency is calculated by dividing the allele count (AC) by the allele number (AN) per row. However, decomposition of SNPs for multiallelic variants means that BCFtools and other tools are unable to properly ascertain the AC and AN. Therefore we implement a method that accounts for these variant representations.
This approach occurs as follows:
- Filter to samples required
- Filter out all GT with a depth of 0 (including alt alleles)
- Count the total number of 1s per row (this is the AC)
- Count the occurences of all ".", 1s and 0s (this is the AN)
- Divide the AC by the AN
We round the allele frequencies to three decimal places if AF ≥ 0.01, and in scientific notation to three decimal places if AF < 0.01. The AC and AN used for each set is provided within the data if you require greater precision.
Note - Variants may be called with 0 depth, this is intended behaviour of the variant caller. We choose to treat such variants as missing for this process.
Worked example:
In the synthetic data example below, the AC, AN and AF columns are provided by the BCFtools plugin "fill-tags". We then have the result as calculated using the method above in manual_AF.
| CHROM | POS | REF | ALT | OLD_CLUMPED | OLD_MULTIALLELIC | AC | AN | AF | S1(GT:DP) | S2 | S3 | S4 | S5 | manual_AF |
|---|---|---|---|---|---|---|---|---|---|---|---|---|---|---|
| chr10 | 3470932 | A | C | . | chr10:3470932:A/C/G/T | 2 | 4 | 0.5 | 0/0:13 | ./.:14 | ./.:13 | ./.:16 | 1/1:0 | 0 |
| chr10 | 3470932 | A | G | . | chr10:3470932:A/C/G/T | 5 | 7 | 0.714 | 0/0:13 | ./1:14 | 1/1:13 | 1/1:16 | ./.:0 | 0.625 |
| chr10 | 3470932 | A | T | . | chr10:3470932:A/C/G/T | 1 | 3 | 0.33 | 0/0:13 | 1/.:14 | ./.:13 | ./.:16 | ./.:0 | 0.125 |
In the example above, we see that treating each "." with a DP > 0 as an allele results in the correct number of total alleles being estimated. We also see that ALT alleles with DP of 0 do not contribute to the allele count or allele number, and therefore are treated same as missing genotypes.
Comparisons to gnomAD data
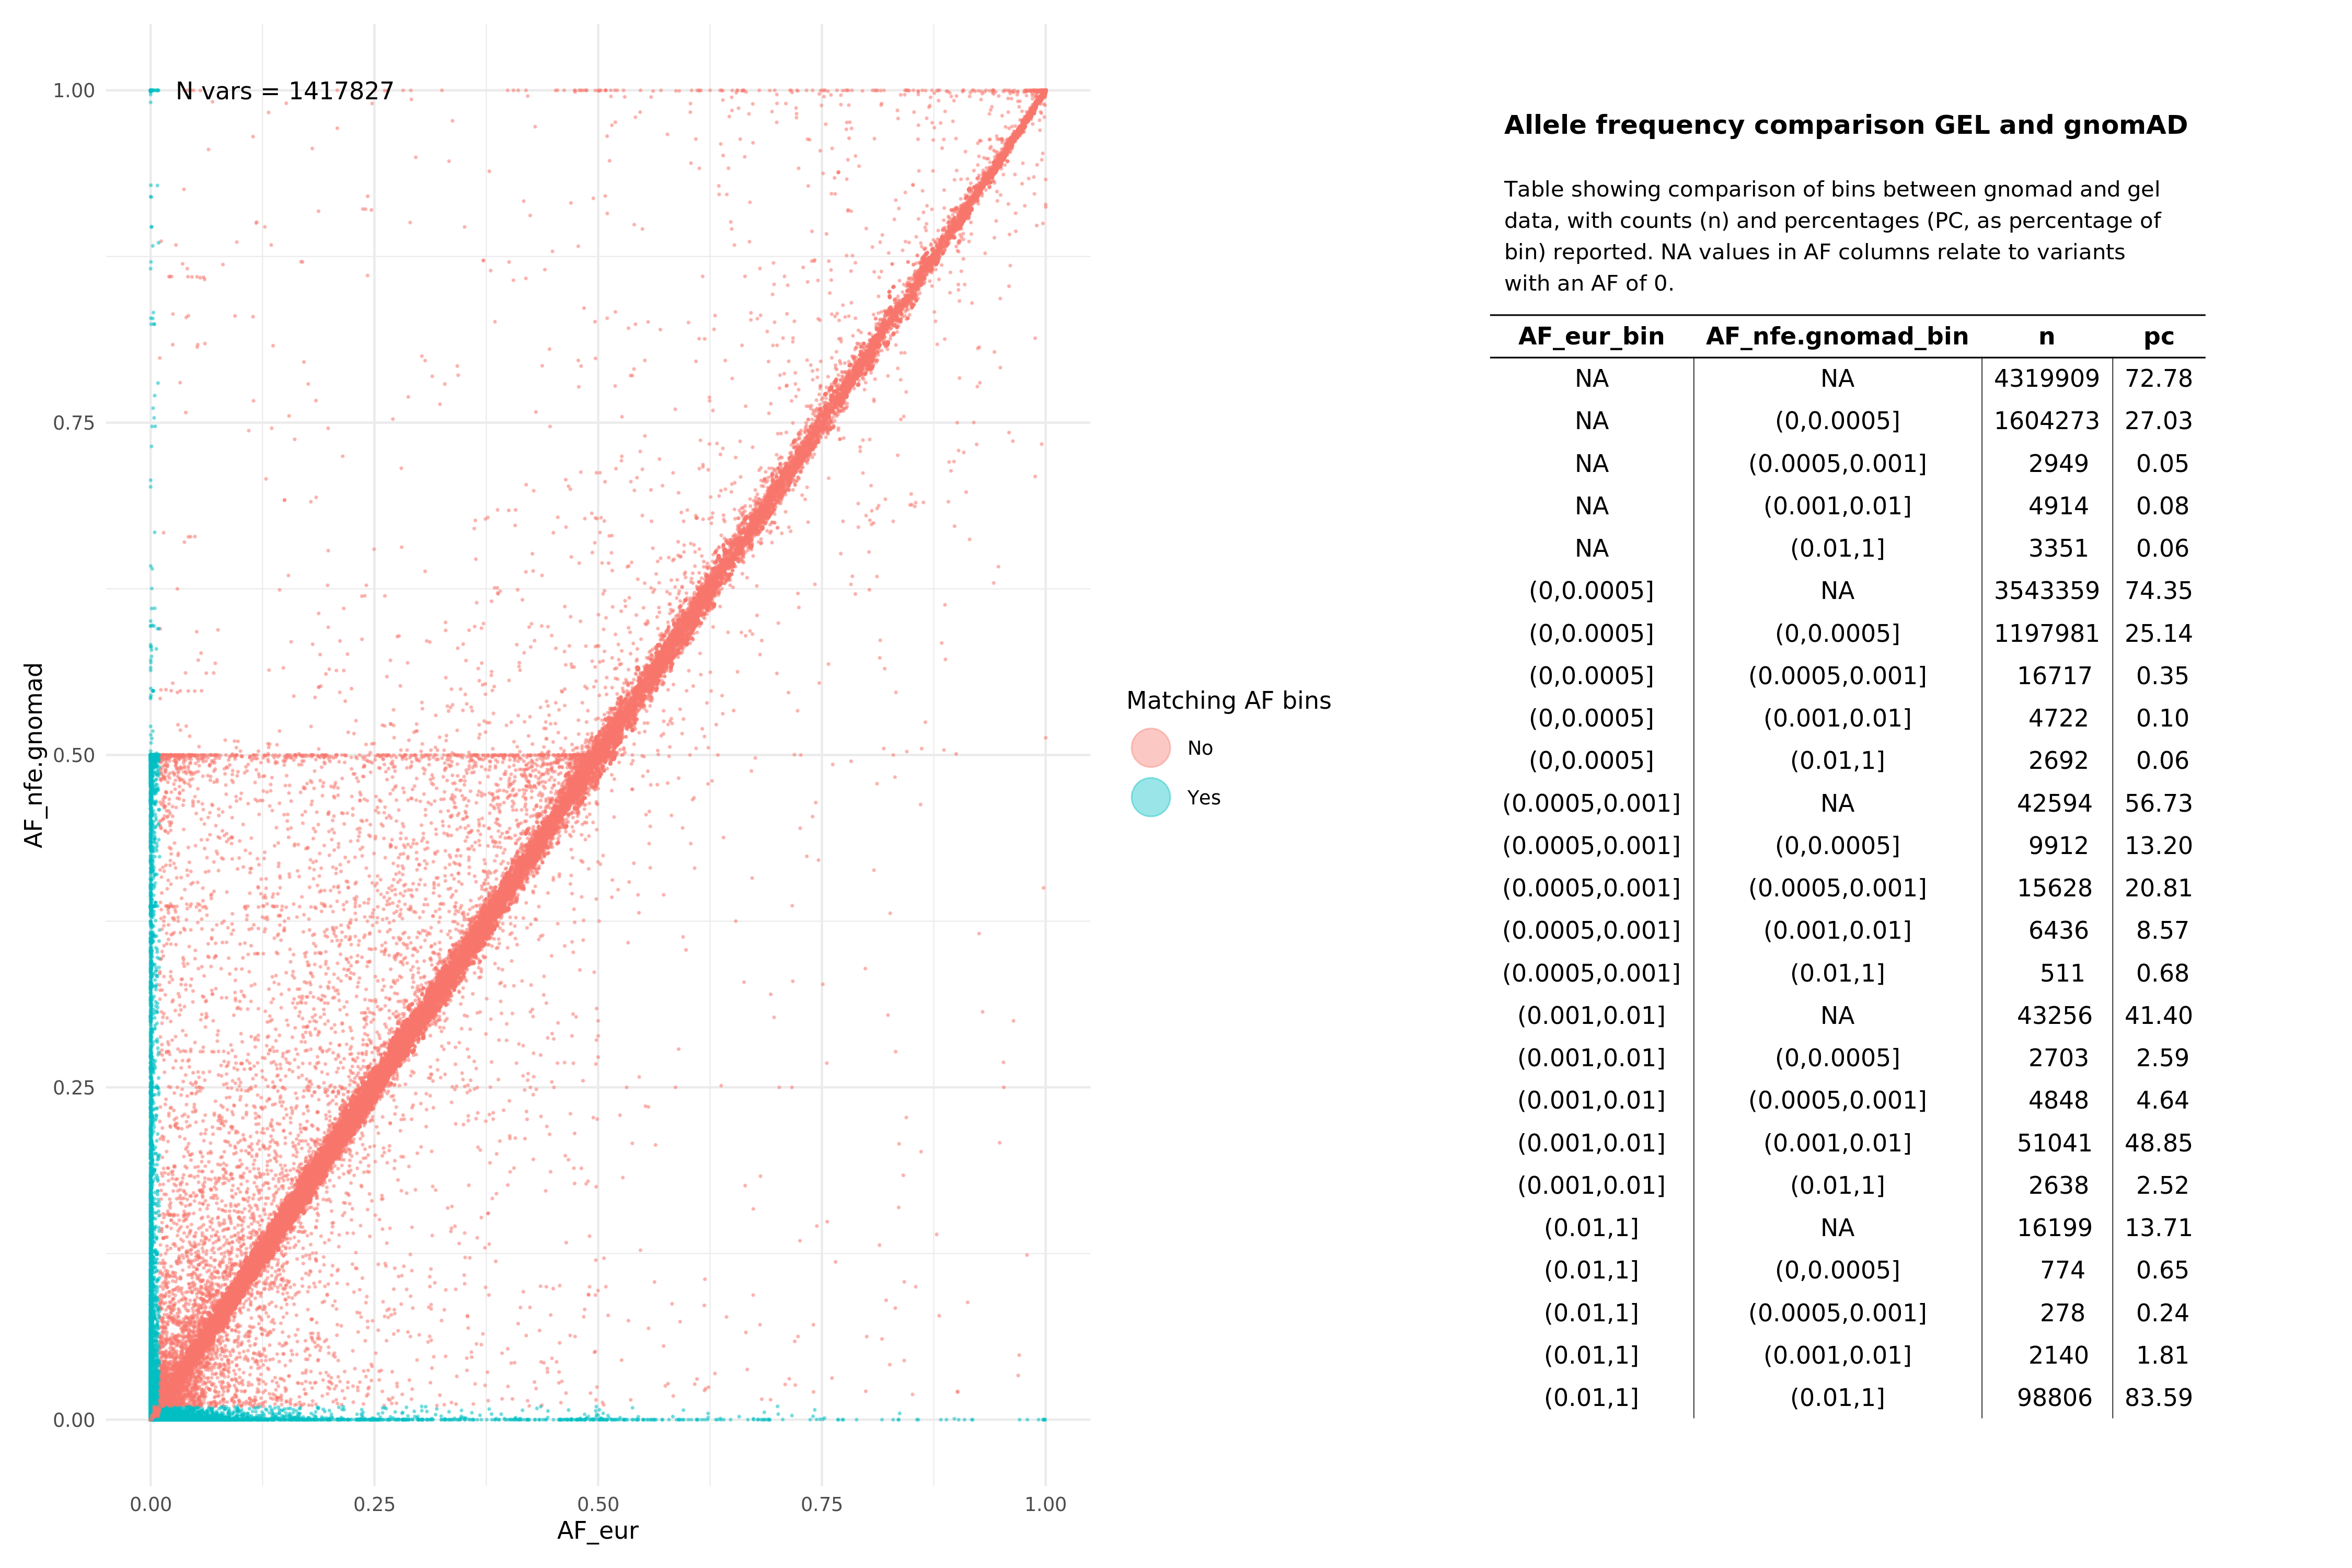
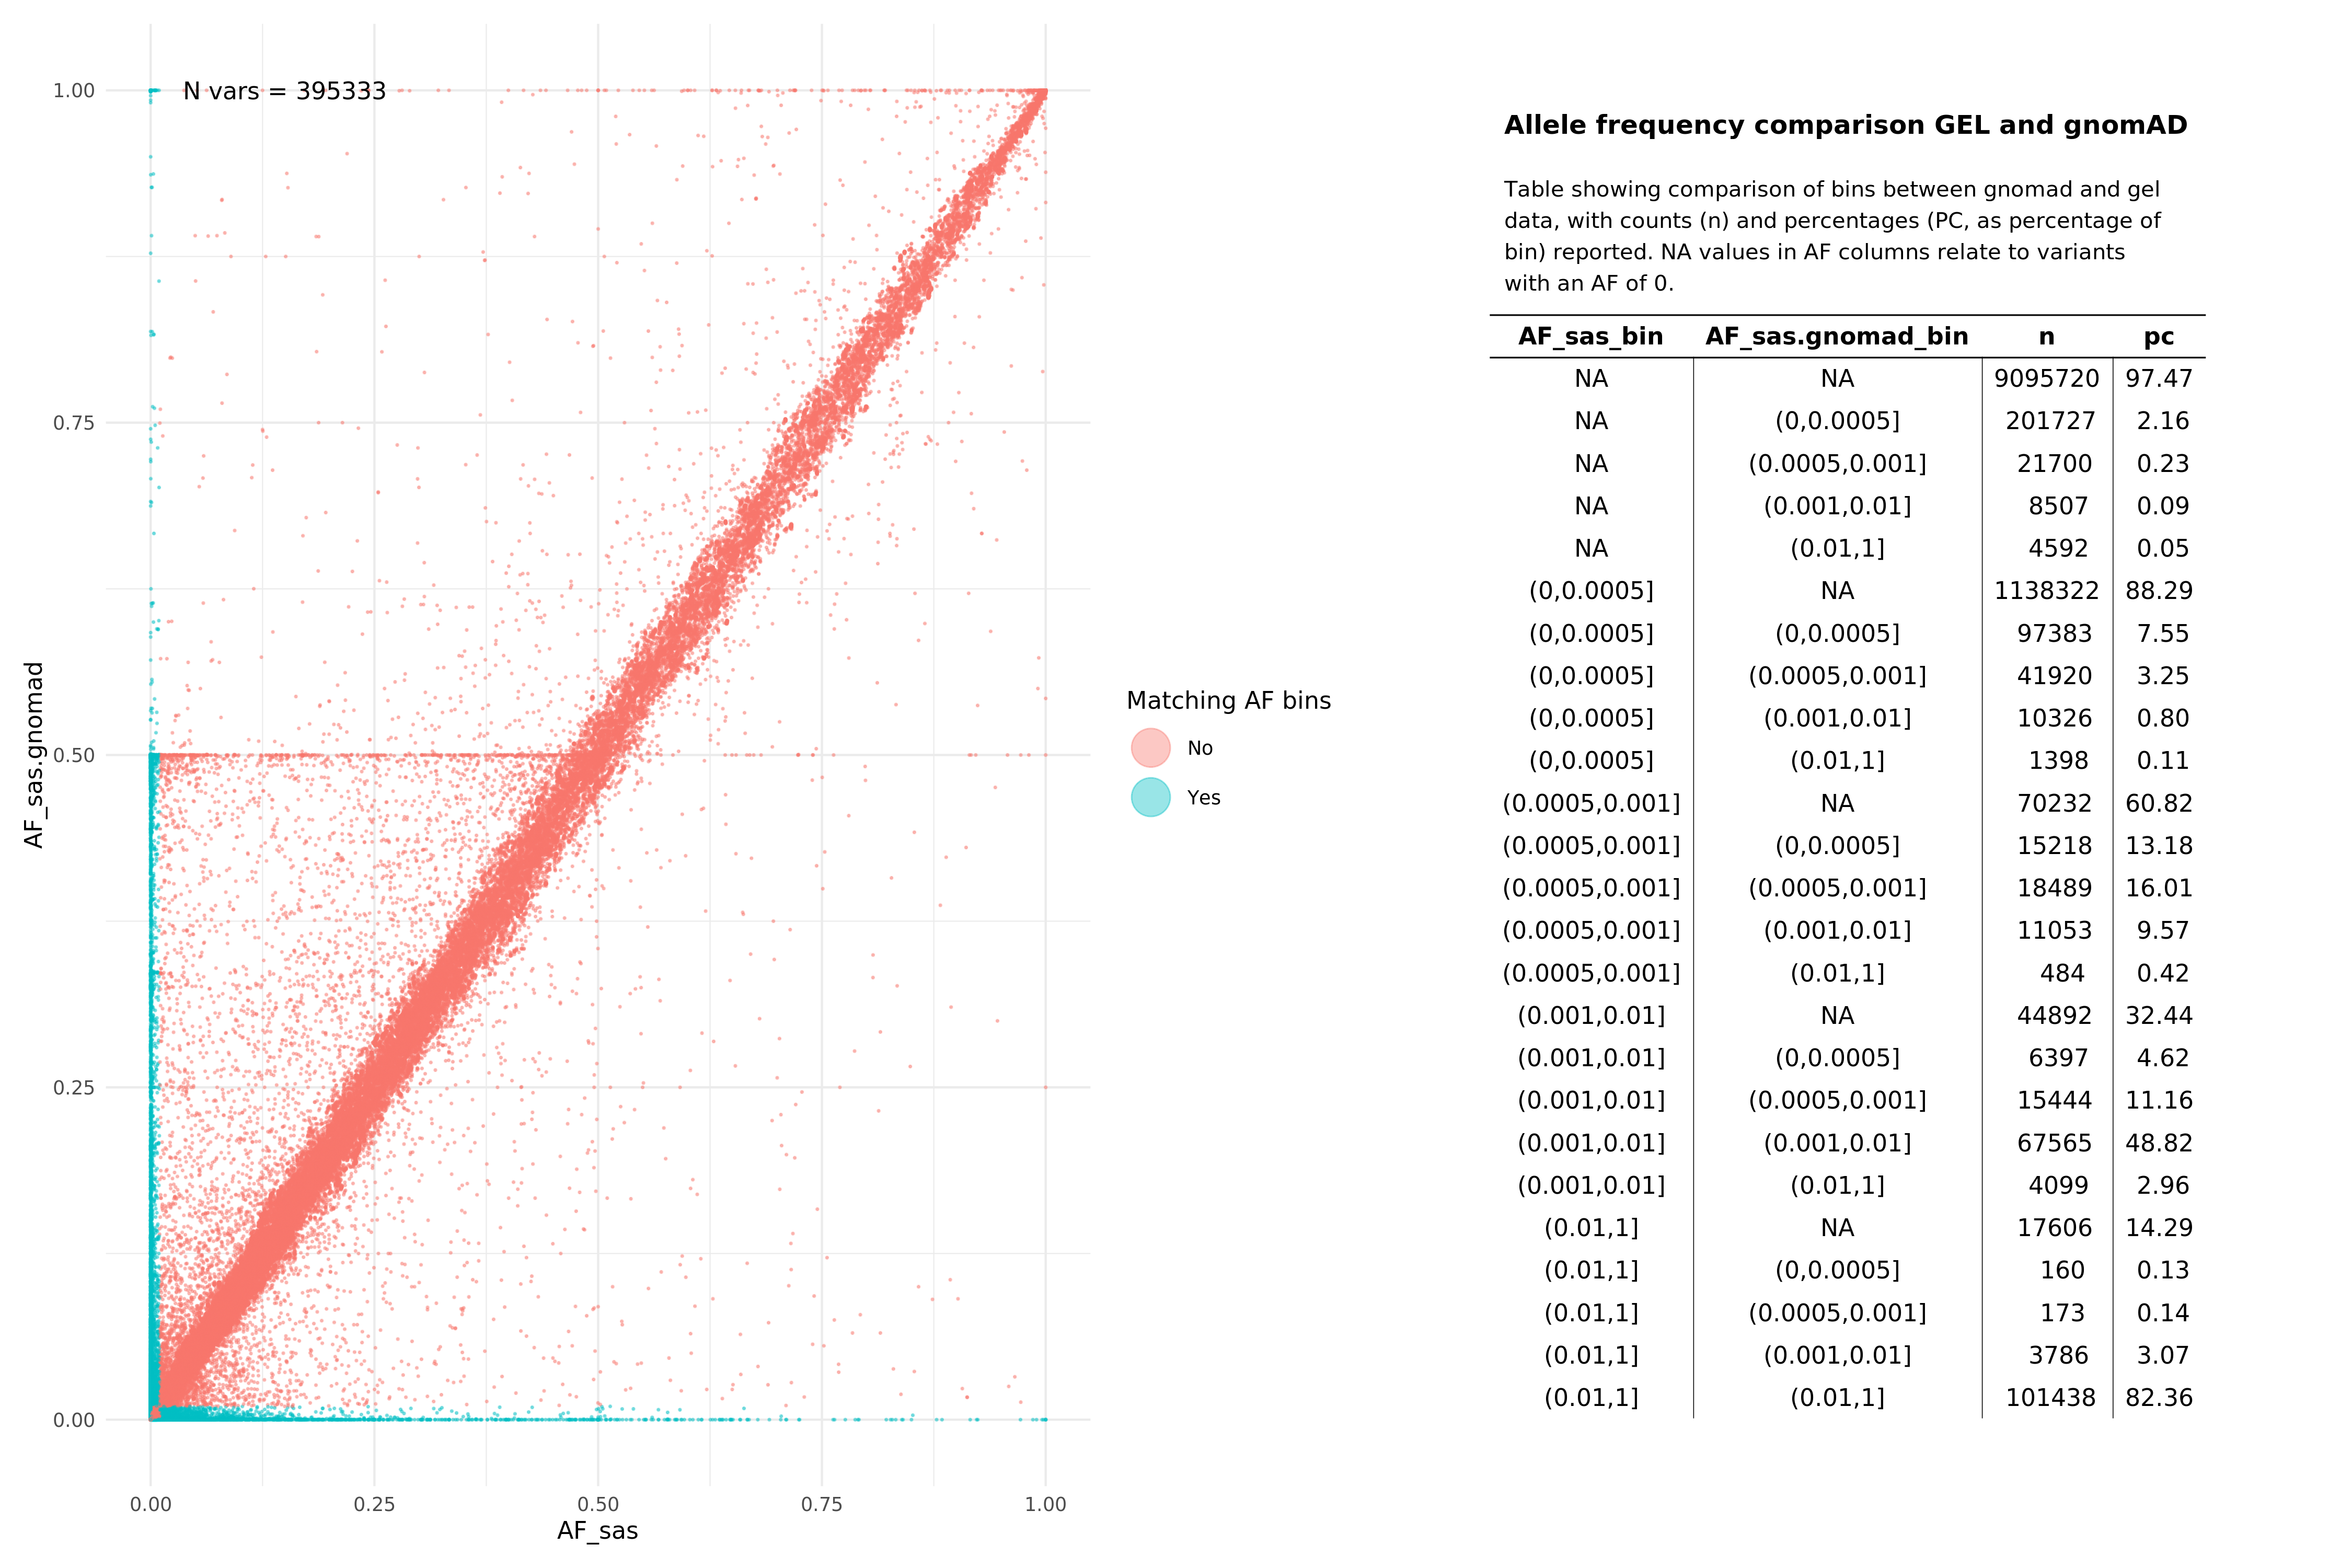
Below we show comparisons of our unrelated, per super-population based AF data with gnomAD. Data below were assembled by taking the all variants from 15 random autosomal chunks, and then subsetting gnomAD v3.1.1 (path: /public_data_resources/gnomad/v3.1.1/vcf) data to the same regions.
We show this across two super populations, comparing eur with non-finnish european (NFE) from gnomAD , and sas across both cohorts. The number of variants being plotted in each graph is denoted by N in the top left hand corner of the plot. NAs refer to variants that are found in one of the subgroups (e.g. in Genomics England eur), but not in the comparison set or vice versa. When looking at pass variants (in both aggV2 and gnomAD), this means that the variant does exist in both datasets, just not the specific subset being examined (e.g. may exist in afr but not in nfe within the gnomAD data).
All variants (SNPs and InDels, pass and fail)
EUR
SAS
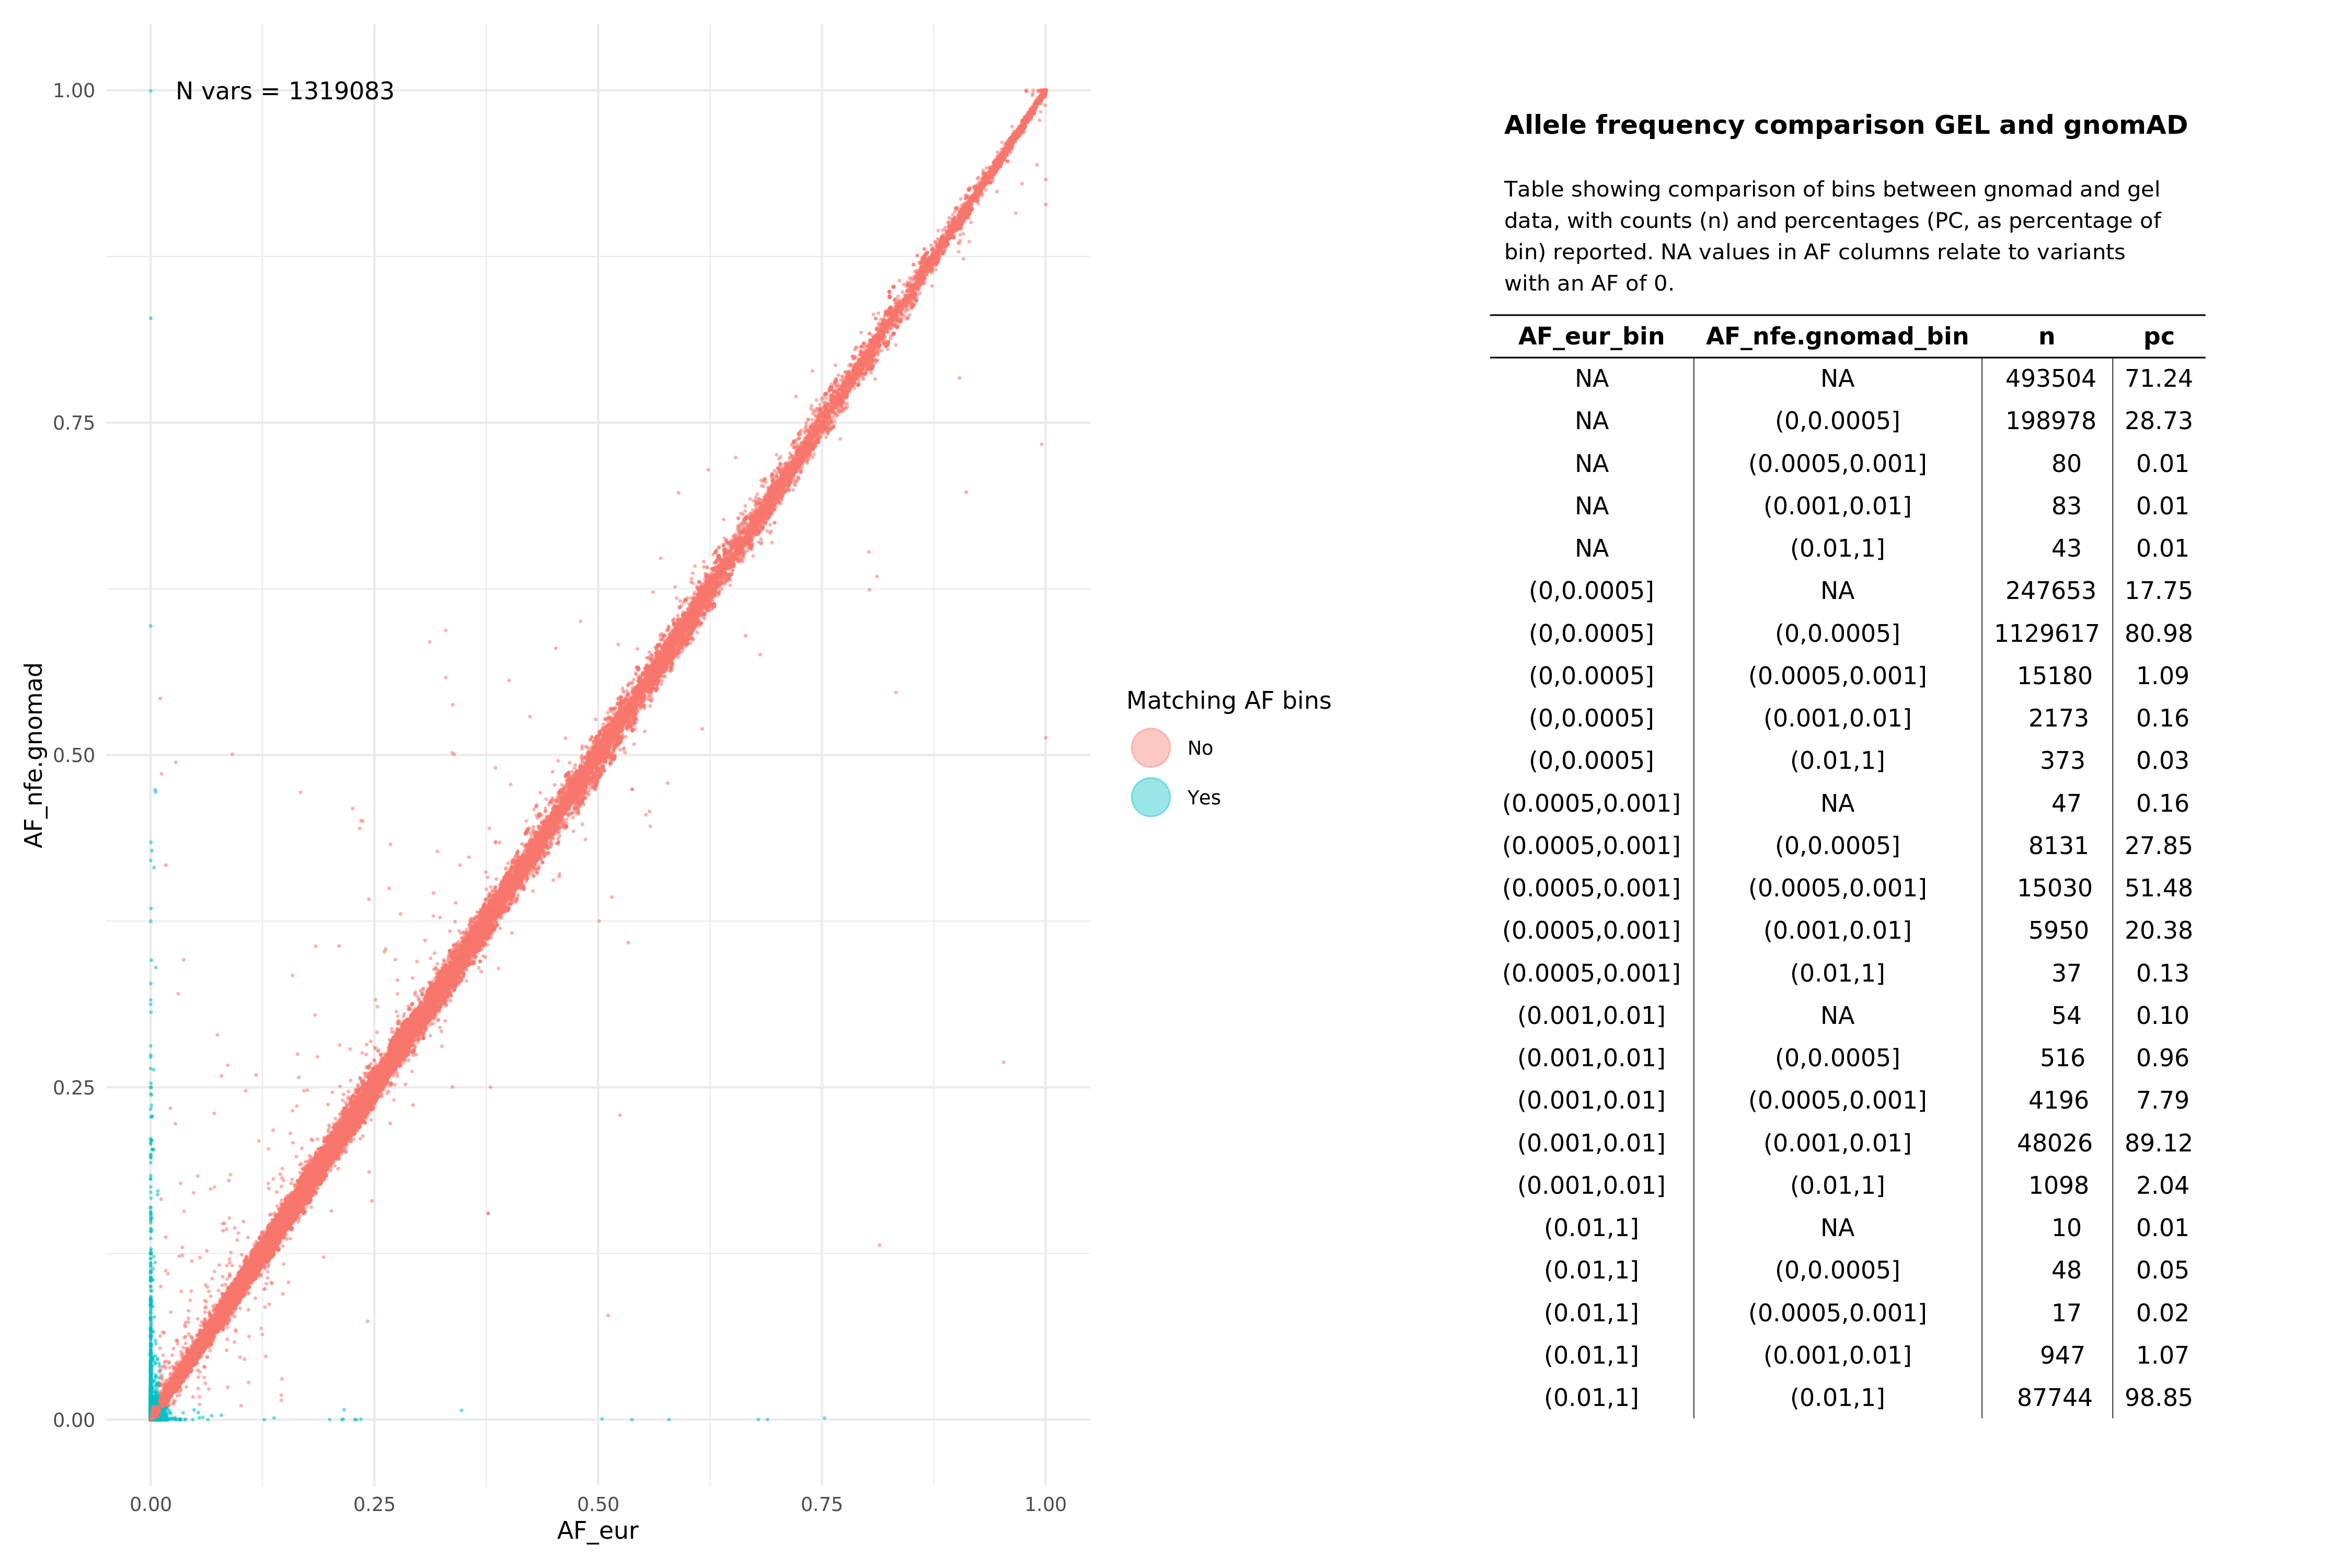
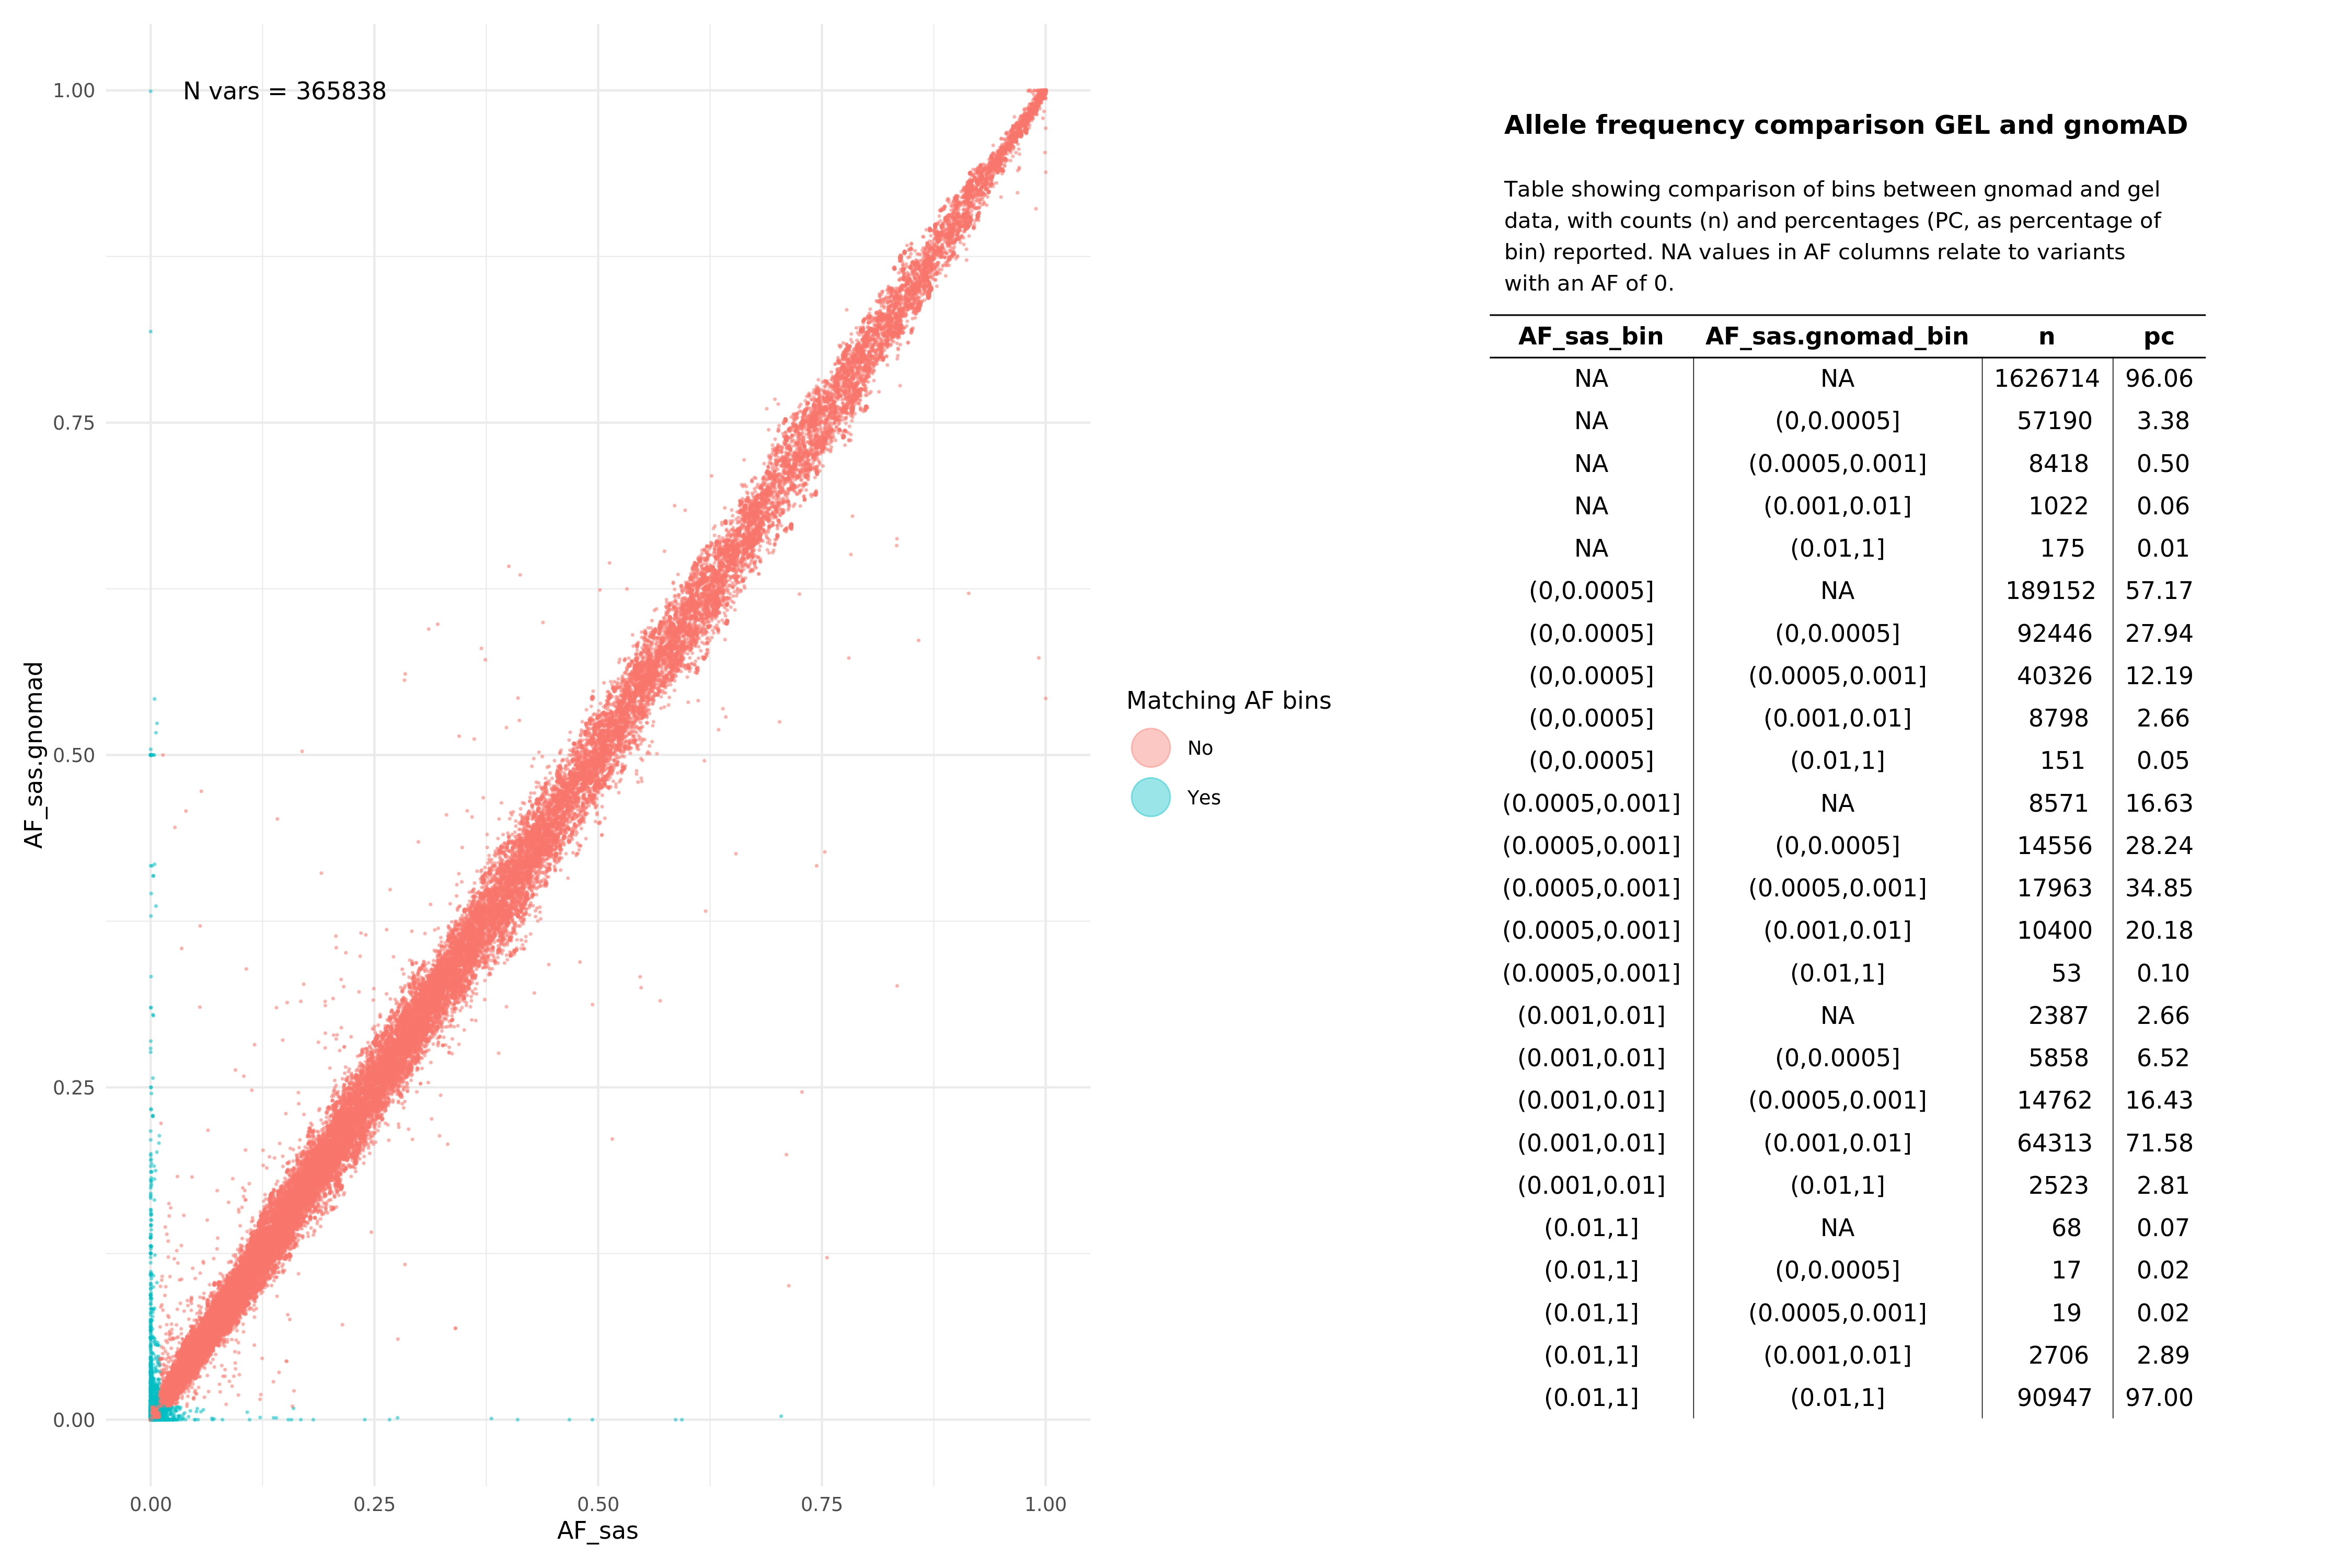
All pass variants (SNPs and InDels, pass in both aggV2 and gnomAD)
EUR
SAS
Help and support
Please reach out via the Genomics England Service Desk for any issues related to the aggV2 aggregation or companion datasets, including "aggV2" in the title/description of your inquiry.