What you can and can't export
As far as possible, all analysis and data handling should be carried out within the Research Environment, with only final results requested for export. Ideally, this data should be aggregate/summary level, if the data is judged to put participants at risk of re-identification the request will be rejected.
Additionally, we operate a data minimisation policy – you should request the minimum amount of data that your research requires.
Airlock requests will be assessed considering the following factors, you should ensure that in your form you fully explain the contents and context of your request:
- Intended use, and whether the contents/size of the data is in line with this.
- Any re-identification risk to participants, including the possibility of combining with previously extracted data.
- Whether you are registered to an approved project with objectives that are in line with the data you are requesting. Requests that fall outside the scope of the project description will not be approved. If this is the case, you will need to email research-network@genomicsengland.co.uk to update the project description or submit a new research project.
- Applications for feasibility studies for prospective industry partners who have not yet joined the Research Network can be made to Genomics England Bioinformatics Research Services Consulting (BRSC).
- When importing data, checks will be performed to ensure that you own the data and hold the correct consents and approvals.
- When exporting data, your project will need to have been approved at least 30 days prior.
All files transferred will be checked for viruses and malware and those failing this test, or files which have been corrupted and can’t be viewed by the Airlock Team, will be rejected. It is your responsibility to resolve such issues before re-submitting the file(s).
The following flow diagram can be used to help you understand whether your request is likely to be approved or rejected.
Below this our rules are described in full detail for further context, all examples given are fictional and are not based on any participants in the NGRL. If after reading this page you are still unsure about whether your data complies with Airlock rules please get in touch at airlock-info@genomicsengland.co.uk.
You can find some examples of common request types and how we review them on this page which may be helpful to contextualise how these rules apply to your data.
%%{ init: { 'flowchart': { 'curve': 'stepAfter' } } }%%
graph TD
    %% Invisible Subgraphs to force vertical grouping
    subgraph Path1 [ ]
        style Path1 fill:none,stroke:none
        A[Are you registered to a project which was approved over 30 days ago?]
        C[Is the file relevent to the project you are registered to?]
        E[Is your file the final results of your analysis?]
        G[Does your file contain GEL IDs - including participant, sample, and family IDs?]
        H[Does your file contain individual level data?]
    end

    subgraph Path2 [ ]
        style Path2 fill:none,stroke:none
        I[Is the file a circos plot, IGV screenshot, Oncoplot or graph showing genetic summary statistics - e.g. tumour mutational burden/mutational signature?]
        K[Are there phenotypic descriptions on an individual level?]
        M[Does your file contain multiple variants per individual?]
        O[De-identified genotypic information on an individual level will generally be allowed for export. We operate a data minimisation policy – you should request the minimum amount of data that your research requires. Therefore please clearly explain in your request why the data is required at an individual level.]
    end

    %% Main Vertical Trunk
    A --> |Yes| C
    C --> |Yes| E
    E --> |Yes| G
    G --> |No| H
    H --> |Yes| I
    I --> |No| K
    K --> |No, only genotypic info| M
    M --> |No| O

    %% Horizontal Side Branches
    A --> |No| B[You can find more information about registering your research here. You will need to wait 30 days after the project is approved to submit export requests.]
    C --> |No| D[Please contact the Research Management Team to update your project if it is no longer in line with your work. Significant updates may require a new project to be registered.]
    E --> |No| F[Raw data is not allowed for export. If you are having issues working inside the RE please raise a service desk ticket. If your work isn't possible inside the RE you can find out more about the limited cases where external analysis is allowed here.]
    G --> |Yes| U[All files containing GEL IDs - other than the public sample IDs - will be rejected for export. You can find out more about how pseudo IDs can be used instead here.]

    %% Individual Level Data Sub-path
    I --> |Yes| J[Safe for export provided that minimal or no phenotypic data is included.]
    J --> K
    K --> |Yes| L[Individual level descriptions are only allowed for export where the risk of re-identification is very low, and the scientific value is very high. See our case study page for more information.]
    L --> M
    M --> |Yes| N[Exporting multiple variants per individual will usually be safe for export if they have been selected for significance.]

    %% Phenotypic Counts Branch
    H --> |No| P[Does your file contain phenotypic counts?]
    P --> |Yes| Q[Phenotypic counts are safe for export as long as all non-zero counts <5 are masked and can't be recalculated. Find out more here.]
    P --> |No| R[Does you file contains variants with counts <20 or frequencies <0.005?]
    Q --> R
    R --> |Yes| S[Small lists of variant curated for significance are generally safe for export. Masking of allele counts/frequencies is required for bulk variant exports, find out more information here.]
    R --> |No| T[If your file contains only summary statistics or aggregated genomic data then it will likely be approved for export. Programming scripts, workflow logs and other files which don't contain any NGRL data will also be approved for export.]

    %% Styling
    classDef question fill:#CDF4FE,stroke:none,color:#2B2F3B;
    classDef no fill:#FFFFFF,stroke:#FF0000,color:#2B2F3B,stroke-width:2px;
    classDef maybe fill:#FFFFFF,stroke:#ffb300,color:#2B2F3B,stroke-width:2px;
    classDef yes fill:#FFFFFF,stroke:#26913d,color:#2B2F3B,stroke-width:2px;

    class A,C,E,G,H,I,K,M,P,R question;
    class B,D,F,U no;
    class L,N,O,Q,S maybe;
    class J,T yes;

    %% Interactive Links
    click B "https://research.genomicsengland.co.uk" "View Registry Help" _blank
    click D "mailto:research-network@genomicsengland.co.uk" "Email Research Team"
    click F "#external-analysis" "External analysis"
    click U "#pseudo-id-systems" "Pseudo ID systems"
    click Q "#count-data" "Count data"
    click L "../case_studies" "Individual level data and case studies"
    click S "#variant-level-data-and-association-outputs-including-gwas" "Variant level data and association outputs (including GWAS)"
The Airlock Team inspect analysed results to ensure they cannot be used to disclose the identity of participants. By using a principles-based approach where each case is assessed individually the security of the dataset is maintained by exporting only ‘safe’ data. This is governed by the Airlock Policy.
Data within the RE has been “de-identified”, which in this context means you cannot view NHS numbers, names, addresses or any direct identifiers of an individual. However, the data you are accessing is still personal data which carries potential identification risk. Participants have given consent for Genomics England to use their data with the agreement that:
‘…although researchers can look at your data and ask questions about it, they can only take away the answers to their questions (their results). They can’t copy or take away any of your individual data’
For this reason, Genomics England does not allow the re-identification of any participant outside the Research Environment – either from the material alone, or through aggregation with other data available now or in the future.
This is why every file requested for export is assessed to ensure that a given description can’t be used to clearly identify an individual. For example:
Rejected
Participant X is 49 years old, had an appendectomy in 2016 and has Dyslexia
Highly identifiable. Although in isolation each clinical detail is common, in combination they paint a very specific picture of a person. If you knew this person in real life you could easily link the published description to that individual.
Approved
Participant X is 40-50 years old, had an appendectomy and has a Specific Learning Disability
Much lower re-identification risk. You may be aware that this description could apply to someone you know, but the details are broad enough that it could apply to many people.
For more information on individual level descriptions please see the case study page.
Summary data still carry a risk of participant identification, and so all data is manually reviewed by a member of the Airlock Team to ensure all approved files are safe for export.
Results usually allowed for export
The following common data/file types are usually approved for export. However, this approval is dependent on the files complying with the Airlock rules listed below (for example not containing any IDs or unmasked counts <5).
- Programming scripts
- Summary statistics (e.g. chi square tests)
- Clustering data
- Summary graphs that don’t reveal phenotypic counts <5
- Coverage data (e.g. IGV screenshots) which don’t contain participant IDs
- Survival curves where the overall cohort size is ≥5
- Circos and Onco plots with no/limited phenotypic information
- Variant, gene and other entity lists without frequencies, counts, or IDs
- Genetic summary information/information inferred from the genetic data (e.g. mutational signature data, microbiome data, risk scores)
- Technical infrastructure which doesn’t contain any NGRL data (e.g. workflow logs, model metrics, config files)
File Types
Binary files will not be considered for Airlock export, and we would prefer that any html files are first converted to pdf or other suitable formats. Zip files are not considered binary files in this context (since the Airlock Team can unzip them to view the contents in full).
Raw sequencing data will not be allowed for export. If you are having technical difficulties working inside the RE please raise a service desk ticket and we can help facilitate your work.
If a specific software is needed to view your file (beyond the Microsoft suite or terminal) please note this in your request. If this software is not freely available, we may request that you convert the file to a different format.
ID Systems
Genomics England IDs
Please remove all participant, sample, family and platekey IDs from files that are intended for export. The way that these IDs are constructed makes them potentially identifying data, so we do not allow any of these IDs for export.
Pseudo ID systems
As part of our commitment to participant privacy, we generally recommend avoiding custom or manually created ID systems, even if they seem anonymous. Over time, when data are exported using the same IDs across multiple files, it can become possible to link information back to individual participants.
If it is necessary to export data at an individual level, we recommend the use of a basic pseudo-ID system rather than anything linked to a participant's phenotype. For example, the ID system Participant 1, Participant 2, Participant 3 is preferable to Female_1, Female_2, Male_1.
We don't allow the use of pseudo-ID systems built around the participants actual participant, sample, family, or platekey IDs (for example the last five digits of their participant ID).
If you are using a pseudo ID system you will need to confirm the following: 1. No previous exports have used this same ID system 2. There is no plan to use this ID system in any future exports
You can confirm this in the 'Additional Comments' section of the Airlock export form to prevent any delays.
If the ID system has been used before/you plan to use it again, please also detail this in your request and we will get in touch with you to discuss further if necessary.
Public Sample IDs
If it is essential to your work to organise the data proposed for export by which patient it originated from in a manner that is linkable across multiple requests and/or with publicly available data, we recommend you use the public sample IDs. These IDs allow researchers to link together data from multiple papers describing these individuals. Please make a note in your Airlock export request explaining why you need to use them.
Explanation of Public Sample ID usage
The public sample IDs are intended to allow the combining of genomic summary statistics and analyses across different papers and research for specific samples. A good example would be mutational signature analyses for cancer samples: several papers have at time of writing been published showing per sample mutational signature information using the public sample IDs. Our hope is that allowing this information to be combined across different studies will allow the creation of scientific insights that would not have been possible if each study used a different ID system.
We are mandated to ensure minimal phenotypic information can be attached to the public sample IDs, due to the potential to combine the phenotypic information about a given ID across many different papers/studies. To date the only phenotypic information that we have allowed for export are:
- Overall cancer type (for the Cancer public IDs) and the normalised specific disease (for the Rare Disease public IDs).
- Age in a 10-year range
- Whether the sample is from the primary tumour or a metastasis
Requests involving public sample IDs must be reviewed alongside all previous exports using the same ID system, hence these will take longer to process. We recommend that requests involving these IDs are submitted at least 10 working days prior to any deadlines.
There may be some capacity to discuss more detailed phenotypic data being attached to the public IDs in future, but please be aware we must be much stricter with files that use these IDs, due to the combinability of data across multiple studies. Requests for further phenotypic data will need to be discussed with the Airlock Committee and so please allow additional time for these to be reviewed.
Count data
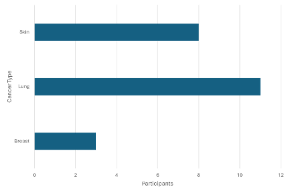
Non-zero counts below 5 (i.e. counts of 1-4) for phenotypic and other potentially identifying data cannot be exported in their exact form. They should be masked as <5. If such data are presented graphically the counts must be obscured in a way that prevent their identification.
Requests where masked counts can be recalculated, for example from a total given elsewhere, will also be rejected.
-
Rejected
¶ -
Approved
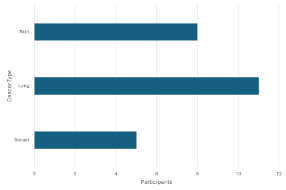
A count <5 can be seen in the left graph so it is rejected. It is visually masked in the graph on the right by setting the minimum value to 5.
-
Rejected
Phenotype Count Skin cancer 8 Lung Cancer 11 Breast Cancer 3
-
Approved
Phenotype Count Skin cancer 8 Lung Cancer 11 Breast Cancer <5
A count <5 can be seen in the table on the left, so it is rejected. It has been masked in the table on the right.
-
Rejected
Phenotype Count Skin cancer 8 Lung Cancer 11 Breast Cancer <5 Total 22
-
Approved
Phenotype Count Skin cancer 8 Lung Cancer 11 Breast Cancer <5 Total 20-24
Although the <5 count has been masked in the table on the left it can be recalculated from the total and the other counts, so it is rejected. The table on the right masks an additional count and so the <5 count can’t be recalculated.
This rule is in place to mitigate identification risks associated with low counts and to comply with our legal agreements with the NHS. For more information on the re-identification risks associated with low counts and why we use a <5 rule to mitigate these, you can read an in-depth review from the Office for National Statistics.
Age
Age needs to be given in a range, exact age/birth year will not be allowed for export. Similarly exact age at diagnosis, treatment etc. will be rejected.
We recommend age is in 10 year range but upon discussion this can be narrowed where there is a scientific reason and the re-identification risk is low. For example, if you are working on a developmental condition where smaller ranges are necessary to assess onset and progression.
Counts of ages, even in ranges, must abide by the <5 rules laid out in the count section above.
Variant level data and association outputs (including GWAS)
Small lists of variants (<300) selected for significance will generally be approved for export.
If you are looking to export large volumes of variants alongside counts/frequencies, you will need to justify the scientific value of the export in order to comply with our principle of data minimisation (Data exported for any given purpose should always be the minimal data needed for that purpose).
Some use cases are well established to require the bulk export of variants, for example association analyses including Genome Wide Association Studies (GWAS). For these exports we require that the minimum minor allele frequency is 0.005 and the minimum allele count is 20. These filters are applied by the standard Genomics England GWAS pipeline.
Gene level data
Masking is not required for counts of gene (and higher) level data.
Gene burden results are allowed for export if they are at the gene level only. Amalgamated allele frequencies of marker variants can be exported; however they must not include the identities of the marker variants within each gene (position-alt-ref). If they do, then the standard GWAS filters will apply (AF >0.005 and AC >20).
Descriptive statistics
Descriptive statistics are generally fine for export; however you will need to ensure that they don’t provide additional information on an individual level which could pose a re-identification risk.
-
Rejected
Participant Phenotype Age 1 Lung Cancer 31-40 2 Lung Cancer 41-50 3 Lung Cancer 51-60 4 Lung Cancer 41-50 Minimum age = 33; Maximum age = 55; Mode = 47
This would be rejected as the minimum and maximum ages directly give the ages of participants 1 and 3 as there are no other participants in those age ranges. Similarly, mode directly gives the ages of 2 and 4 as they’re the only participants whose ages are in the same range so could possibly be the most common age.
External analysis
As far as possible, all analysis and data handling should be carried out within the Research Environment, with only final analysis results requested for export. In certain cases, where the work can’t be done inside the RE, we may consider allowing an export for external analysis.
Before raising an Airlock ticket to export the files please get in touch with the Service Desk to discuss the technical issues you are having. You will need to prove that they have been unable to find a way for you to continue your work inside the RE before we can consider allowing you to export data for external analysis.
Data requested for external analysis cannot be individual level and must abide by the other Airlock rules on this page (including masking counts and removing any IDs). We will also ask you to agree to a set of conditions including:
- The data files will not be used for any purpose other than the specific work stated in the export request.
- Any external environment in which the data files are stored must be secure. Genomics England may impose specific technical criteria to areas where the data are to be stored/analysed.
- Once the specified analyses are completed, the resulting data will be uploaded to the Research Environment for further analysis and any requests to export data outside the Research Environment will be subject to the usual airlock process.
- The data files will be deleted from all locations that they are stored outside the Research Environment once this analysis is completed.
An external analysis approval does not confer agreement to use or share the results of those analyses outside the Research Environment. Once you have uploaded the resulting data from your analysis back into the RE you can raise a new Airlock Ticket to get approval to publish.
Any approval granted is specifically for the data in the request at that specific time. Researchers should not rely on similar requests in the future being approved as the Research Environment’s capabilities may change allowing for similar work to be completed internally at a future point in time.
Note on references
The development of the following principles has been influenced by, and in some cases directly taken from, the following documents:
- Guidelines for the checking of output based on microdata research, by Steve Bond, Maurice Brandt, and Peter-Paul de Wolf.
- Self-study material for the users of Eurostat microdata sets, European Commission.
- Guidelines for the checking of output based on microdata research, by Maurice Brandt, Luisa Franconi, Christopher Guerke, Anco Hundepool, Maurizio Lucarelli, Jan Mol, Felix Ritchie, Giovanni Seri, and Richard Welpton
- Principles- versus rules-based output statistical disclosure control in remote access environments, by Felix Ritchie and Mark Elliot