Cancer staging statistics 16
The below statistics were taken from the cancer_staging_consolidated LabKey table from the 100kGP V16 data release. The table is built from the participant IDs and Tumour Sample Plate-key IDs from the cancer_analysis table which comprises QC-passed and interpreted tumour-normal genome pairs.
Completion as a percent of samples in the cancer_analysis table
This table shows the rate of data completion as a percentage of the total number of distinct participants and distinct tumour sample plate-keys in the cancer_analysis table vs the cancer_staging_consolidated table. Please note that this indicates the number of entries (participants or tumour sample plate-keys, respectively) for which we have stage information from one of the three input sources (cancer_participant_tumour, av_tumour, sact) within 12 months of acquiring the tumour sample. No additional checks were conducted.
| # | cancer_analysis | cancer_staging_consolidated | % complete |
|---|---|---|---|
| Distinct Participants | 15,208 | 12,316 | 80.98 |
| Distinct Tumour Sample Plate-keys | 16,323 | 13,078 (number of rows in cancer_staging_consolidated table) | 80.12 |
Completion rates of cancer_staging_consolidated by each source of staging
This table shows the number and rate of completion of tumour_sample plate-keys (n = 13,078) that are linked each of the three sources of staging. Note the link must be within a year of the tumour_clinical_sample_time field from the cancer_analysis table.
| Source | Number of tumour sample plate-keys | % complete |
|---|---|---|
| av_tumour | 12,432 | 95.06 |
| cancer_participant_tumour | 5,831 | 44.59 |
| sact | 3,319 | 25.37 |
Summary and Distribution of time-difference days between tumour clinical sample time and staging information
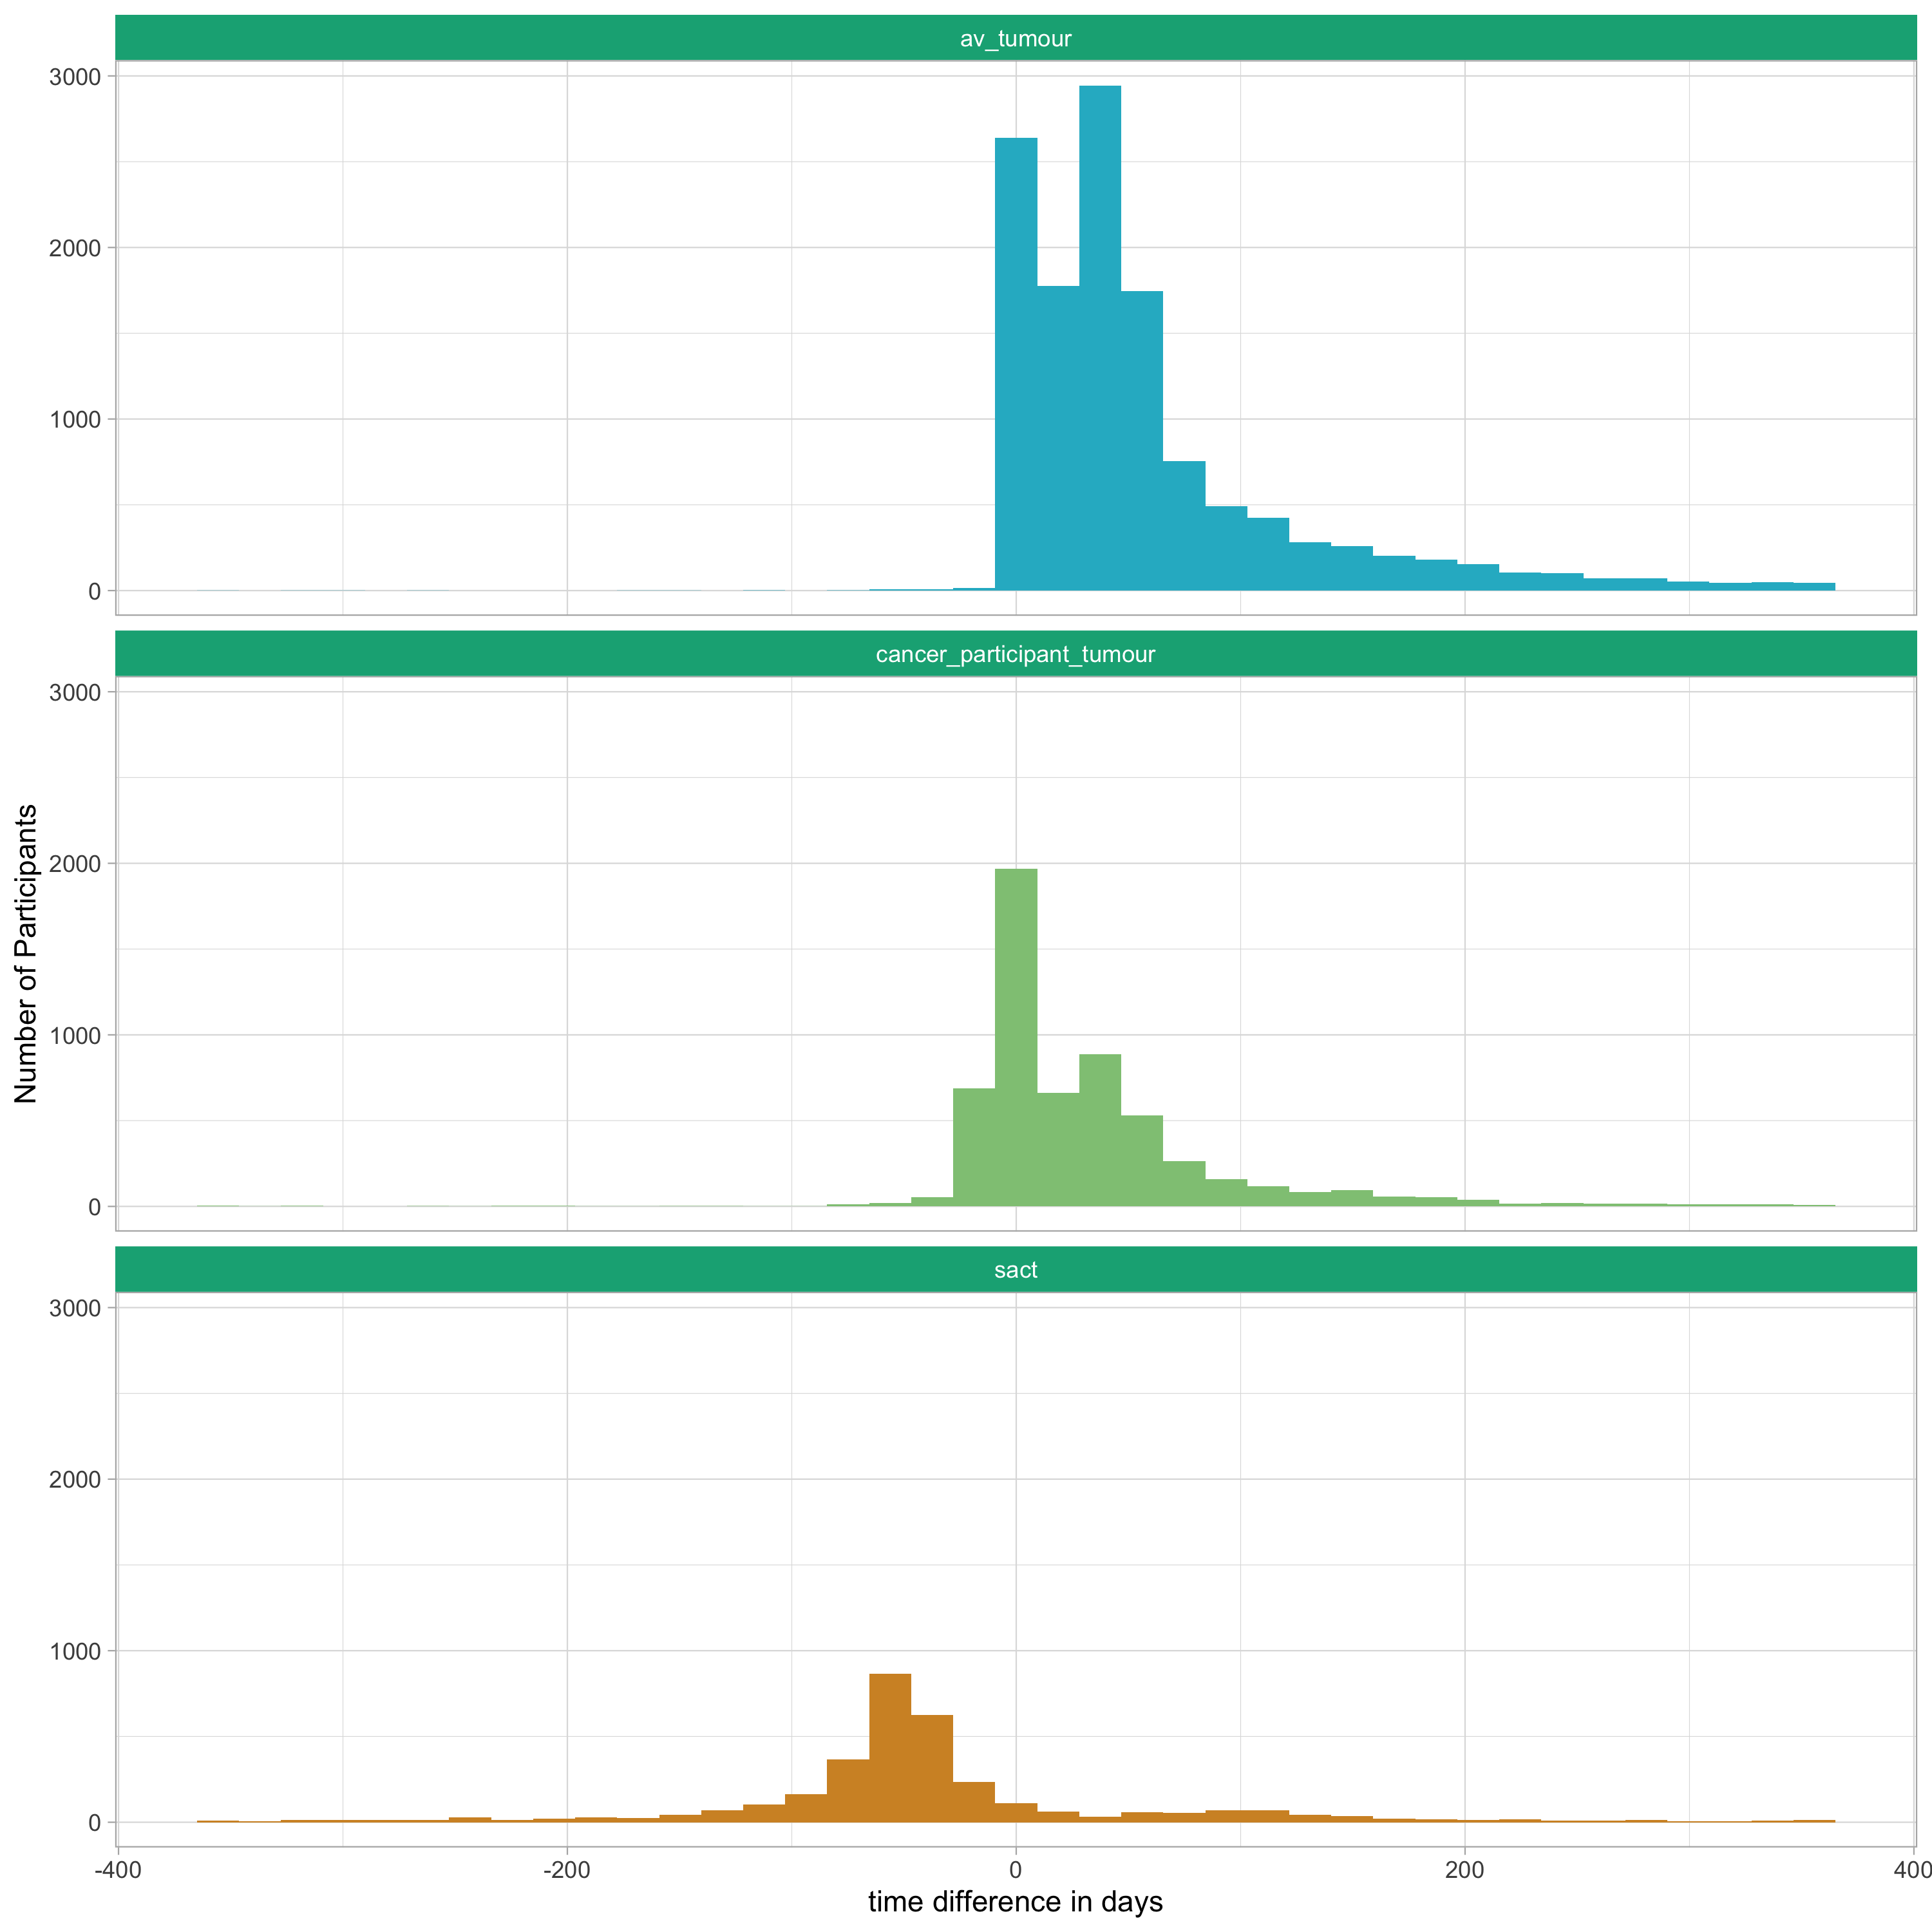
This table shows the summary statistics of the distribution of time (in days) between the tumour_clinical_sample_time and the date of staging data acquisition. This is broken down by the three sources of staging.
NB: Note that in the below table and histogram, positive values indicate that the date of staging data acquisition is before the tumour_clinical_sample_time. Negative values indicate that the date of staging data acquisition is after the tumour_clinical_sample_time.
| Stat | cancer_participant_tumour | av_tumour | sact |
|---|---|---|---|
| minimum | -365 | -360 | -365 |
| q1 | 0 | 18 | -69 |
| median | 16 | 39 | -49 |
| mean | 31.64 | 57.56 | -37.29 |
| q3 | 48 | 69 | -25 |
| maximum | 365 | 365 | 365 |
| NA | 7,247 | 646 | 9,760 |
The below histograms show the same data but as a frequency distribution.
Frequency of the nearest staging source to the tumour clinical sample time for each tumour sample plate-key
The below table shows the break down of the tumour_sample plate-keys (n = 13,080) by the nearest source of staging data. For example if a tumour_sample plate-key has both linked av_tumour and sact staging entries, then the nearest entry to the tumour_clinical_sample_time is taken.
| Staging Source | Frequency |
|---|---|
| cancer_participant_tumour | 4,672 |
| av_tumour | 7,229 |
| sact | 1,177 |
Frequency of breakdown by combination of data sources for each tumour sample plate-key
This table shows the frequency breakdown of the three sources of staging data across the tumour_sample plate-keys (n = 13,078). For example, if a tumour_sample plate-key has only cancer_participant_tumour and sact data available, then these two data sources are marked as Y.
| cancer_participant_tumour | av_tumour | sact | Frequency |
|---|---|---|---|
| 0 | 1 | 0 | 5,327 |
| 1 | 1 | 0 | 4,100 |
| 0 | 1 | 1 | 1,640 |
| 1 | 1 | 1 | 1,365 |
| 1 | 0 | 0 | 333 |
| 0 | 0 | 1 | 280 |
| 1 | 0 | 1 | 33 |