View participant
On the participant details page, you can find information about the participant, their family (for rare disease), where to access their genome data and their medical history. This is organised on a single page in the following clickable sections on the right of the page:
 Key participant details
- Key referral or recruitment details
- Family member details
 Genome sequence details
 List of medical encounters
 Medical history timeline
You can manually scroll down the page, or use the icons in the top right to directly jump to a specific section.
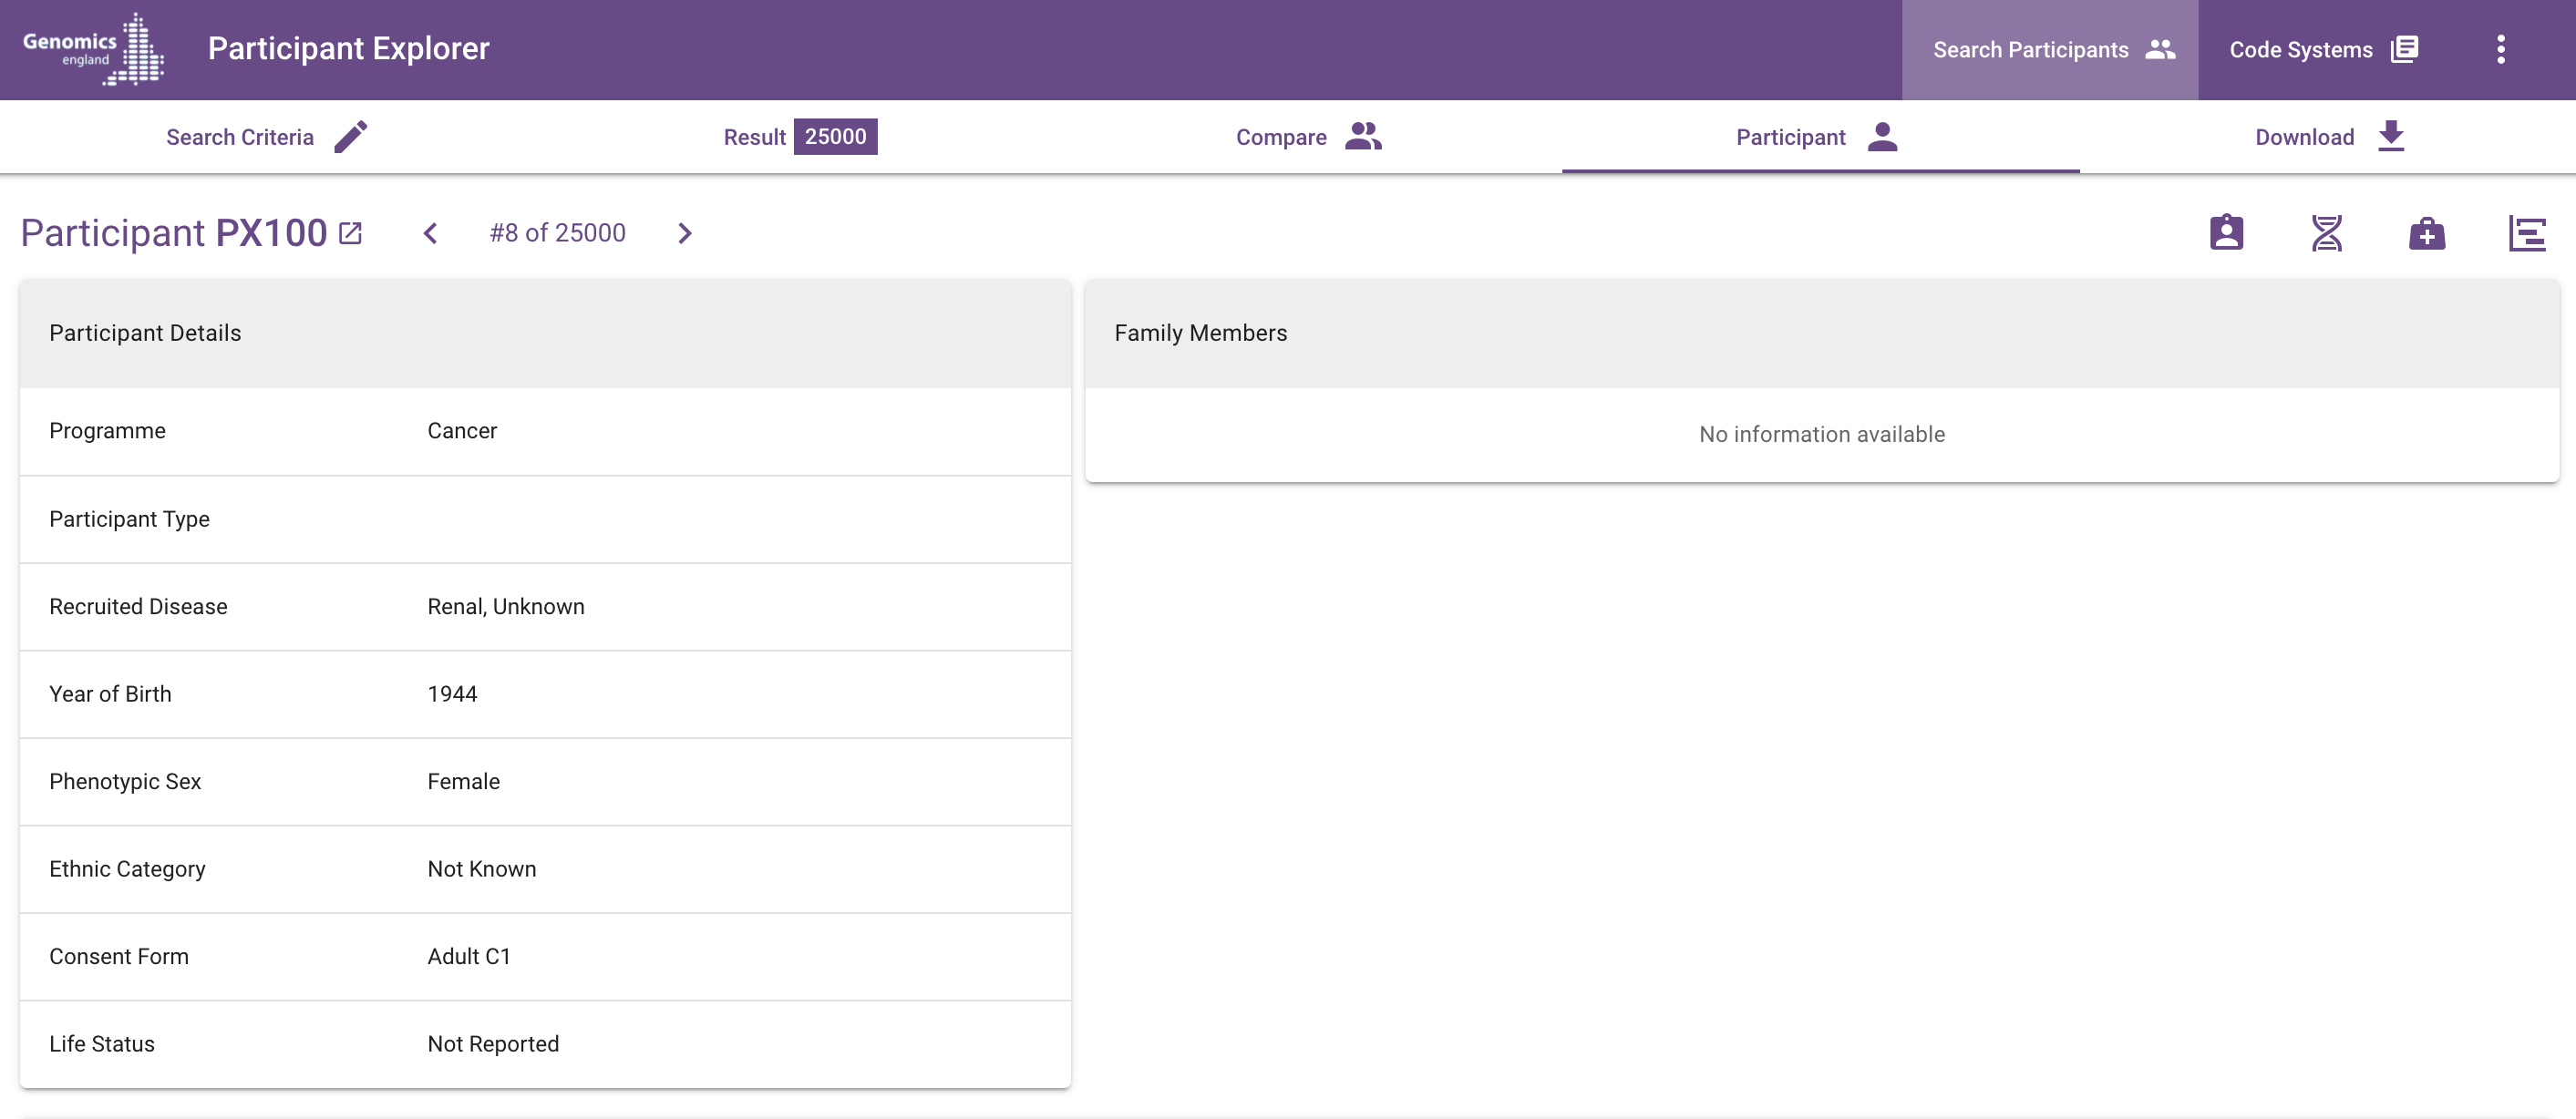
Participant details
The link arrow immediately to the right of the participant ID will open the Labkey table for the source of the data in a new tab.
Click on the arrows in the header to the right of the participant ID to view the previous or next participant in the search result. To return to the list of participants, click in between the arrows or on the Result tab.
| Column | Notes |
|---|---|
| Participant ID | The Genomics England participant ID |
| Source | The origin of the participant data, the 100,000 Genomes Project (100kGP) or the NHS Genomic Medicine Service (NHS-GMS) |
| Year of Birth | |
| Stated Gender | The stated gender of the participant at test or recruitment |
| Phenotypic Sex | Participant's phenotypic sex classification at birth captured at recruitment |
| Ethnic Category | This is the reported ethnic category, not the genetically inferred ancestry |
| Life Status | "Deceased" if reported (by ONS, CEN or GLH), empty otherwise. |
Referral details
| Column | Notes |
|---|---|
| Referral ID | A Genomics England identifier assigned to the primary participant (and their relatives). Also known as Case ID or Family ID |
| Participant Type | Whether the participant was recruited as a proband or relative |
| Disease Category | The programme or category the participant was recruited/tested under : "Rare Diseases" or "Cancer" |
| Clinical Indication | The primary reason the participant was referred for genomic testing. For Rare Disease 100kGP participants, only the specific disease is displayed. For Cancer 100kGP participants, type and sub-type are displayed. Multiple diseases are displayed on separate lines. |
| Family Case Solved | Have the results reported explained the genetic basis of the family’s presenting phenotype(s)? (Yes/No/Partially/Unknown). The Family Case Comments field can provide some details and the source data in LabKey can be opened via the link icon. |
| Referral Date | For NHS-GMS, the recorded date of referral. For 100kGP, the date can be ambiguous so is omitted. An approximate date might be inferred on the Medical History Timeline. Multiple referrals are ordered most recent first |
| Family Members Tested | The number of family members as a numeral for NHS-GMS, or type of family, e.g. 'Singleton', 'Trio with Mother and Father', as a string for 100kGP. The source link opens the referral_participant (NHS-GMS) or rare_diseases_pedigree_member (100kGP) table. |
| Family Members Available | The number of family members available in the NGRL and Participant Explorer. May be fewer than the number tested due to consent withdrawals or other issues such as failing data quality checks. |
Family member details
| Column | Notes |
|---|---|
| Relationship to Proband | The family relationship relative to the proband. "Proband" is used for the proband themself. |
| Affection Status | Affection status (with respect to the recruited disease of the proband) |
| Stated Gender | The stated gender of the participant |
| Phenotypic Sex | The participant's phenotypic sex classification at birth |
| Participant ID | Participant ID (for participating family members) |
| Pedigree Member ID | Pedigree member ID (100kGP only) |
| Column | Notes |
|---|---|
| Currently Viewing | The relationship of the current page's participant to the proband |
| Medical Review Date | For 100kGP Rare Disease cases only, the medical review date, family group type and family ID |
| Family Case Comments | Comments on the case reported during analysis. |
Notes:
- The participant currently being viewed is highlighted by a small purple circle in the list of family members
- The list of family members may include participant IDs which are no longer included in the data release, for example if they have withdrawn their consent.
- A small number of participants (100kGP only) are members of more than one pedigree (related probands). In that case, the list of family members will display multiple probands with each proband followed by the family members in that pedigree.
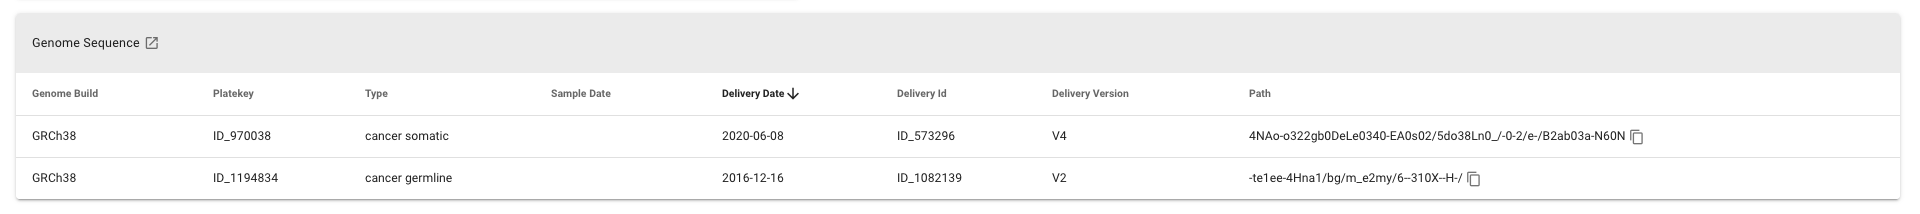
Genome sequence
A list of available sequencing reports for the participant. The external-link in the header can be used to open the corresponding LabKey table in a new tab.
| Column | Notes |
|---|---|
| Genome Build | Reference genome build |
| Platekey | ID of the plated sample used for sequencing |
| Type | The genome sequence report type (a combination of programme and sample type) |
| Sample Date | The date the sample used for sequencing was taken in the clinic. |
| Delivery Date | The genome sequence report delivery date |
| Delivery ID | The genome sequence report delivery ID |
| Delivery Version | The version of the pipeline used to process and analyse the sequencing data |
| Path | The path to the genome sequence files on the file system. The copy-icon next to the path can be used to copy the full path to the clipboard. |
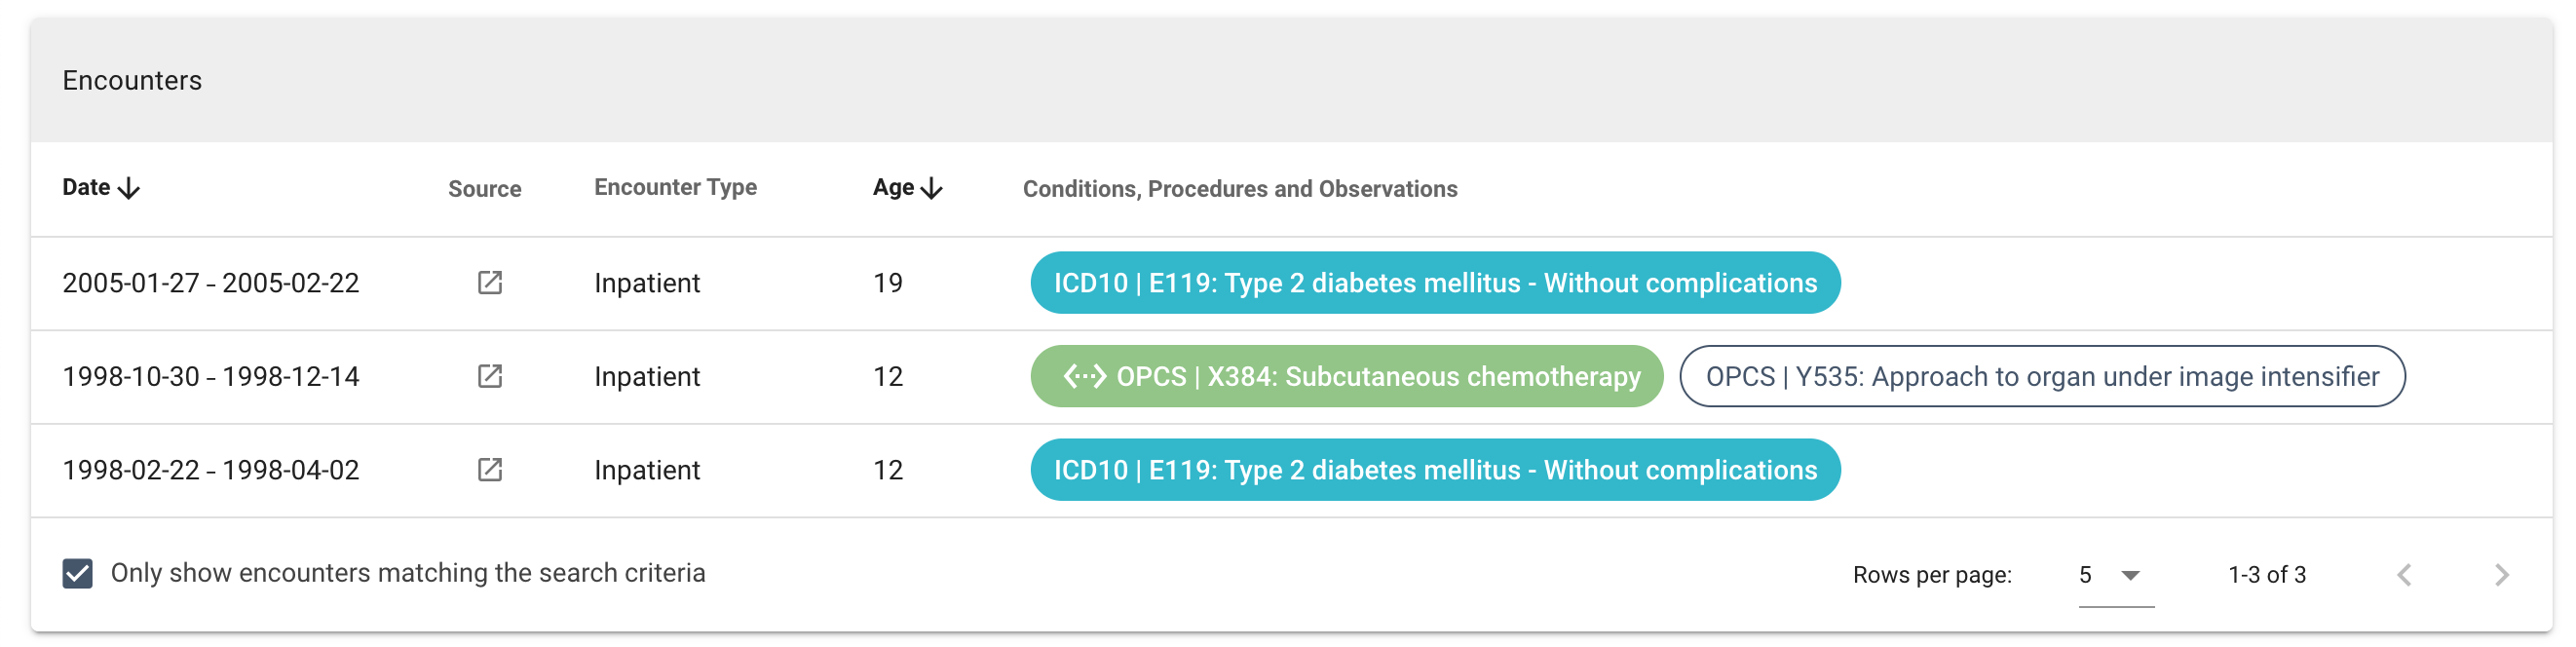
Encounters
A list of medical encounters (healthcare interactions) for the participant. By default, only conditions, observations, procedures and/or drugs that match the search criteria are visible. By unchecking the "Only show encounters matching the search criteria" tickbox, all available encounters can be viewed. See examples below:
| Column | Notes |
|---|---|
| Date | The date or period of the encounter |
| Source | Links to one or more LabKey tables with filters corresponding to the encounter |
| Encounter Type | The type of encounter. This also indicates the source of the encounter data: Genomics England (100,000 Genomes Project), Inpatient (HES APC), Outpatient (HES OP), Emergency Care (ECDS), Diagnostic Imaging (DID), Mental Health Services (MHMD), Office of National Statistics, National Cancer Registration, Chemotherapy (SACT) and Radiotherapy (RTDS) |
| Age | Participant age at the time of the encounter (calculated) |
| Conditions, Procedures, Observations and Drugs | List of condition, observation, procedure codes and/or drugs associated with the encounter. Terms from the search criteria are coloured blue (directly selected terms) or green (automatically added mapped concepts), while additional codes are white. |
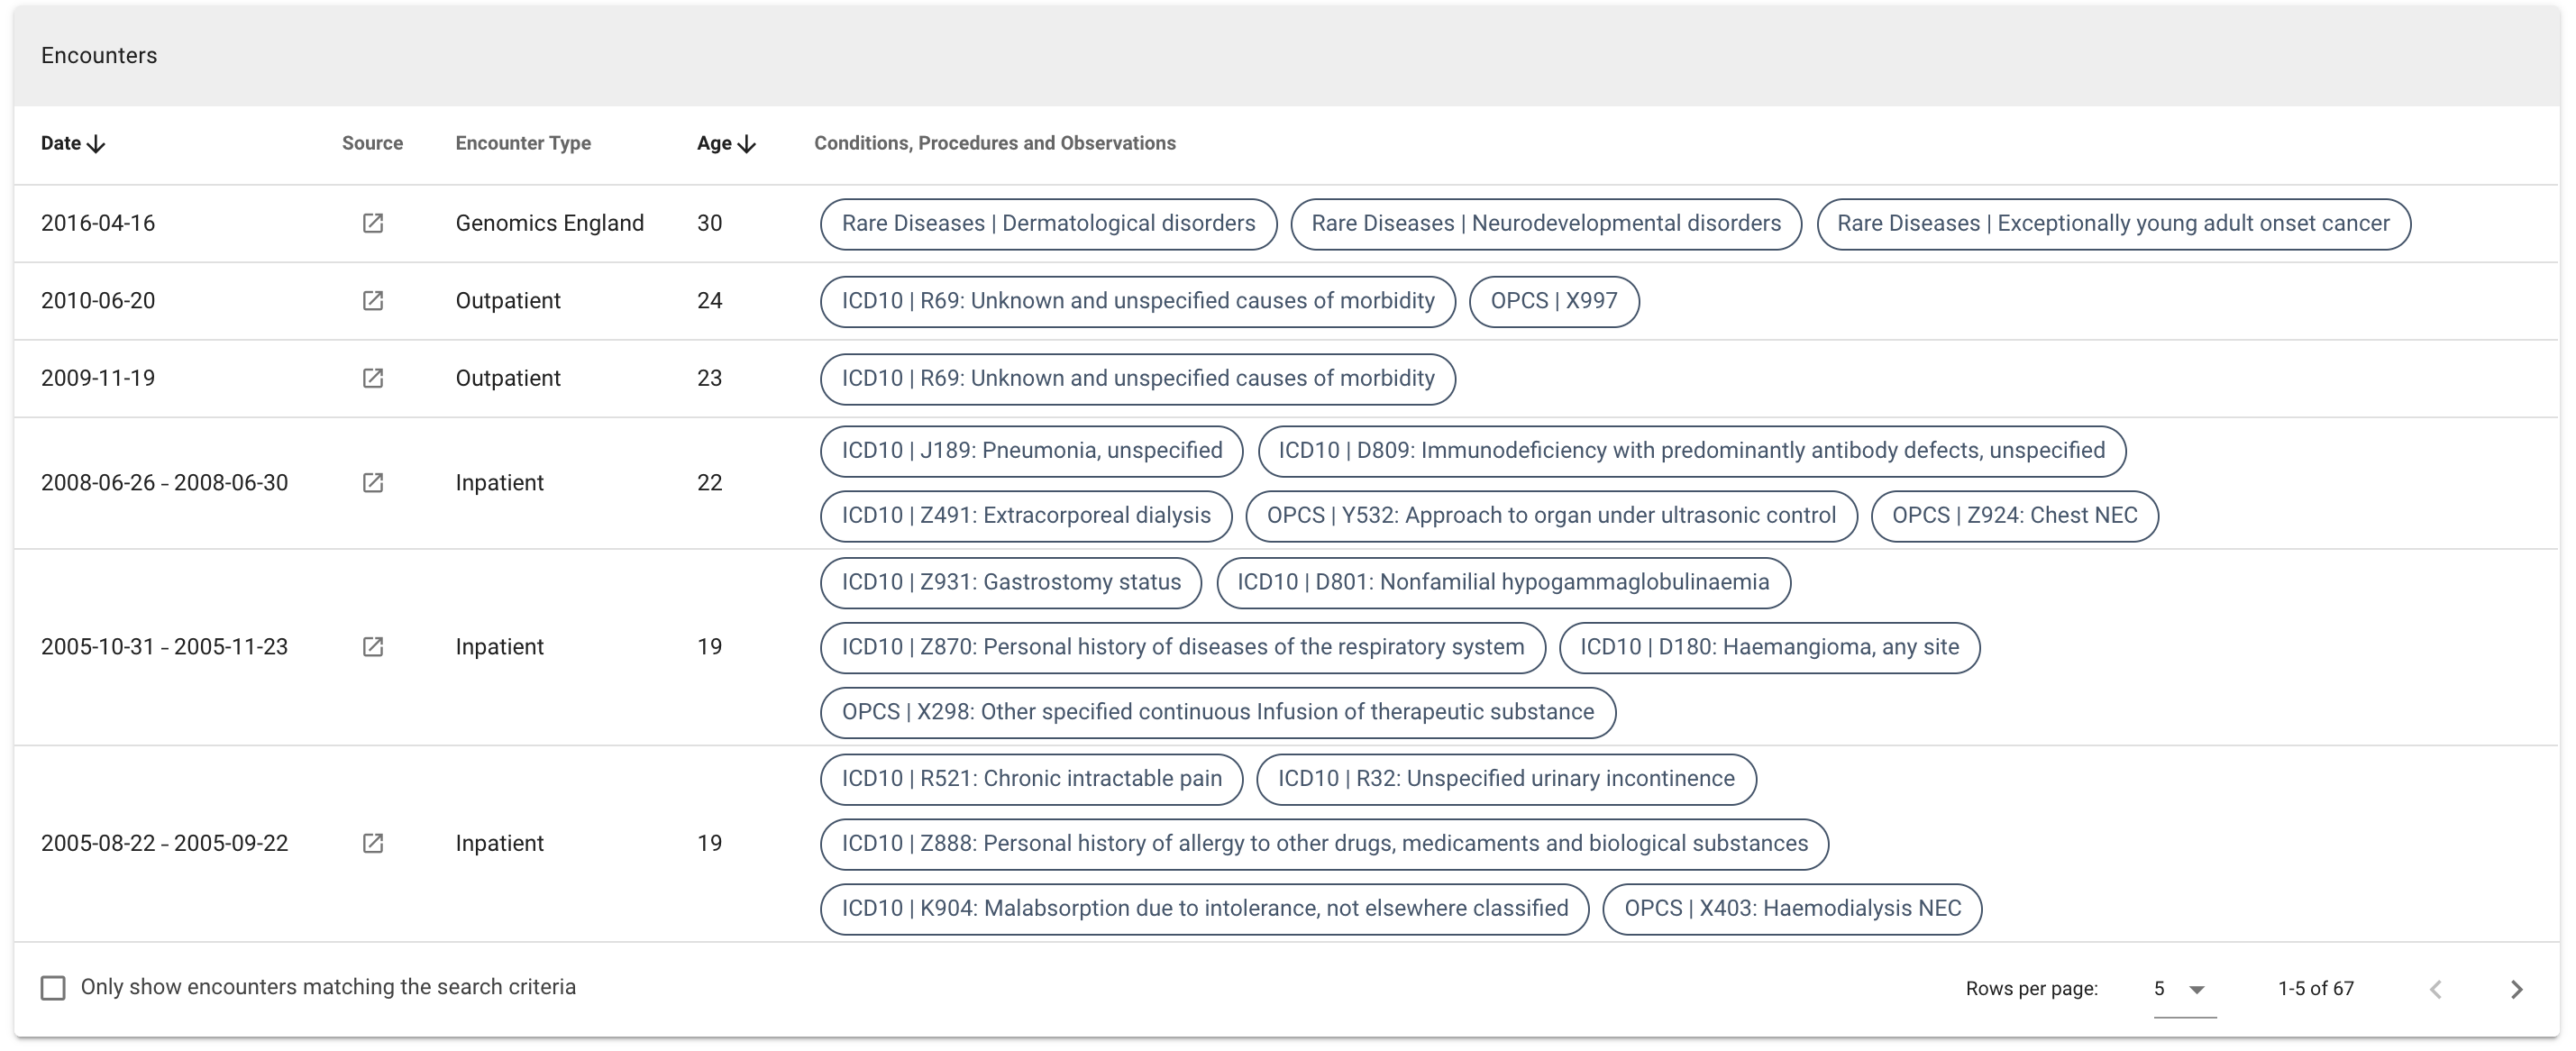
Uncheck the box to see all the encounters:
Medical history timeline 
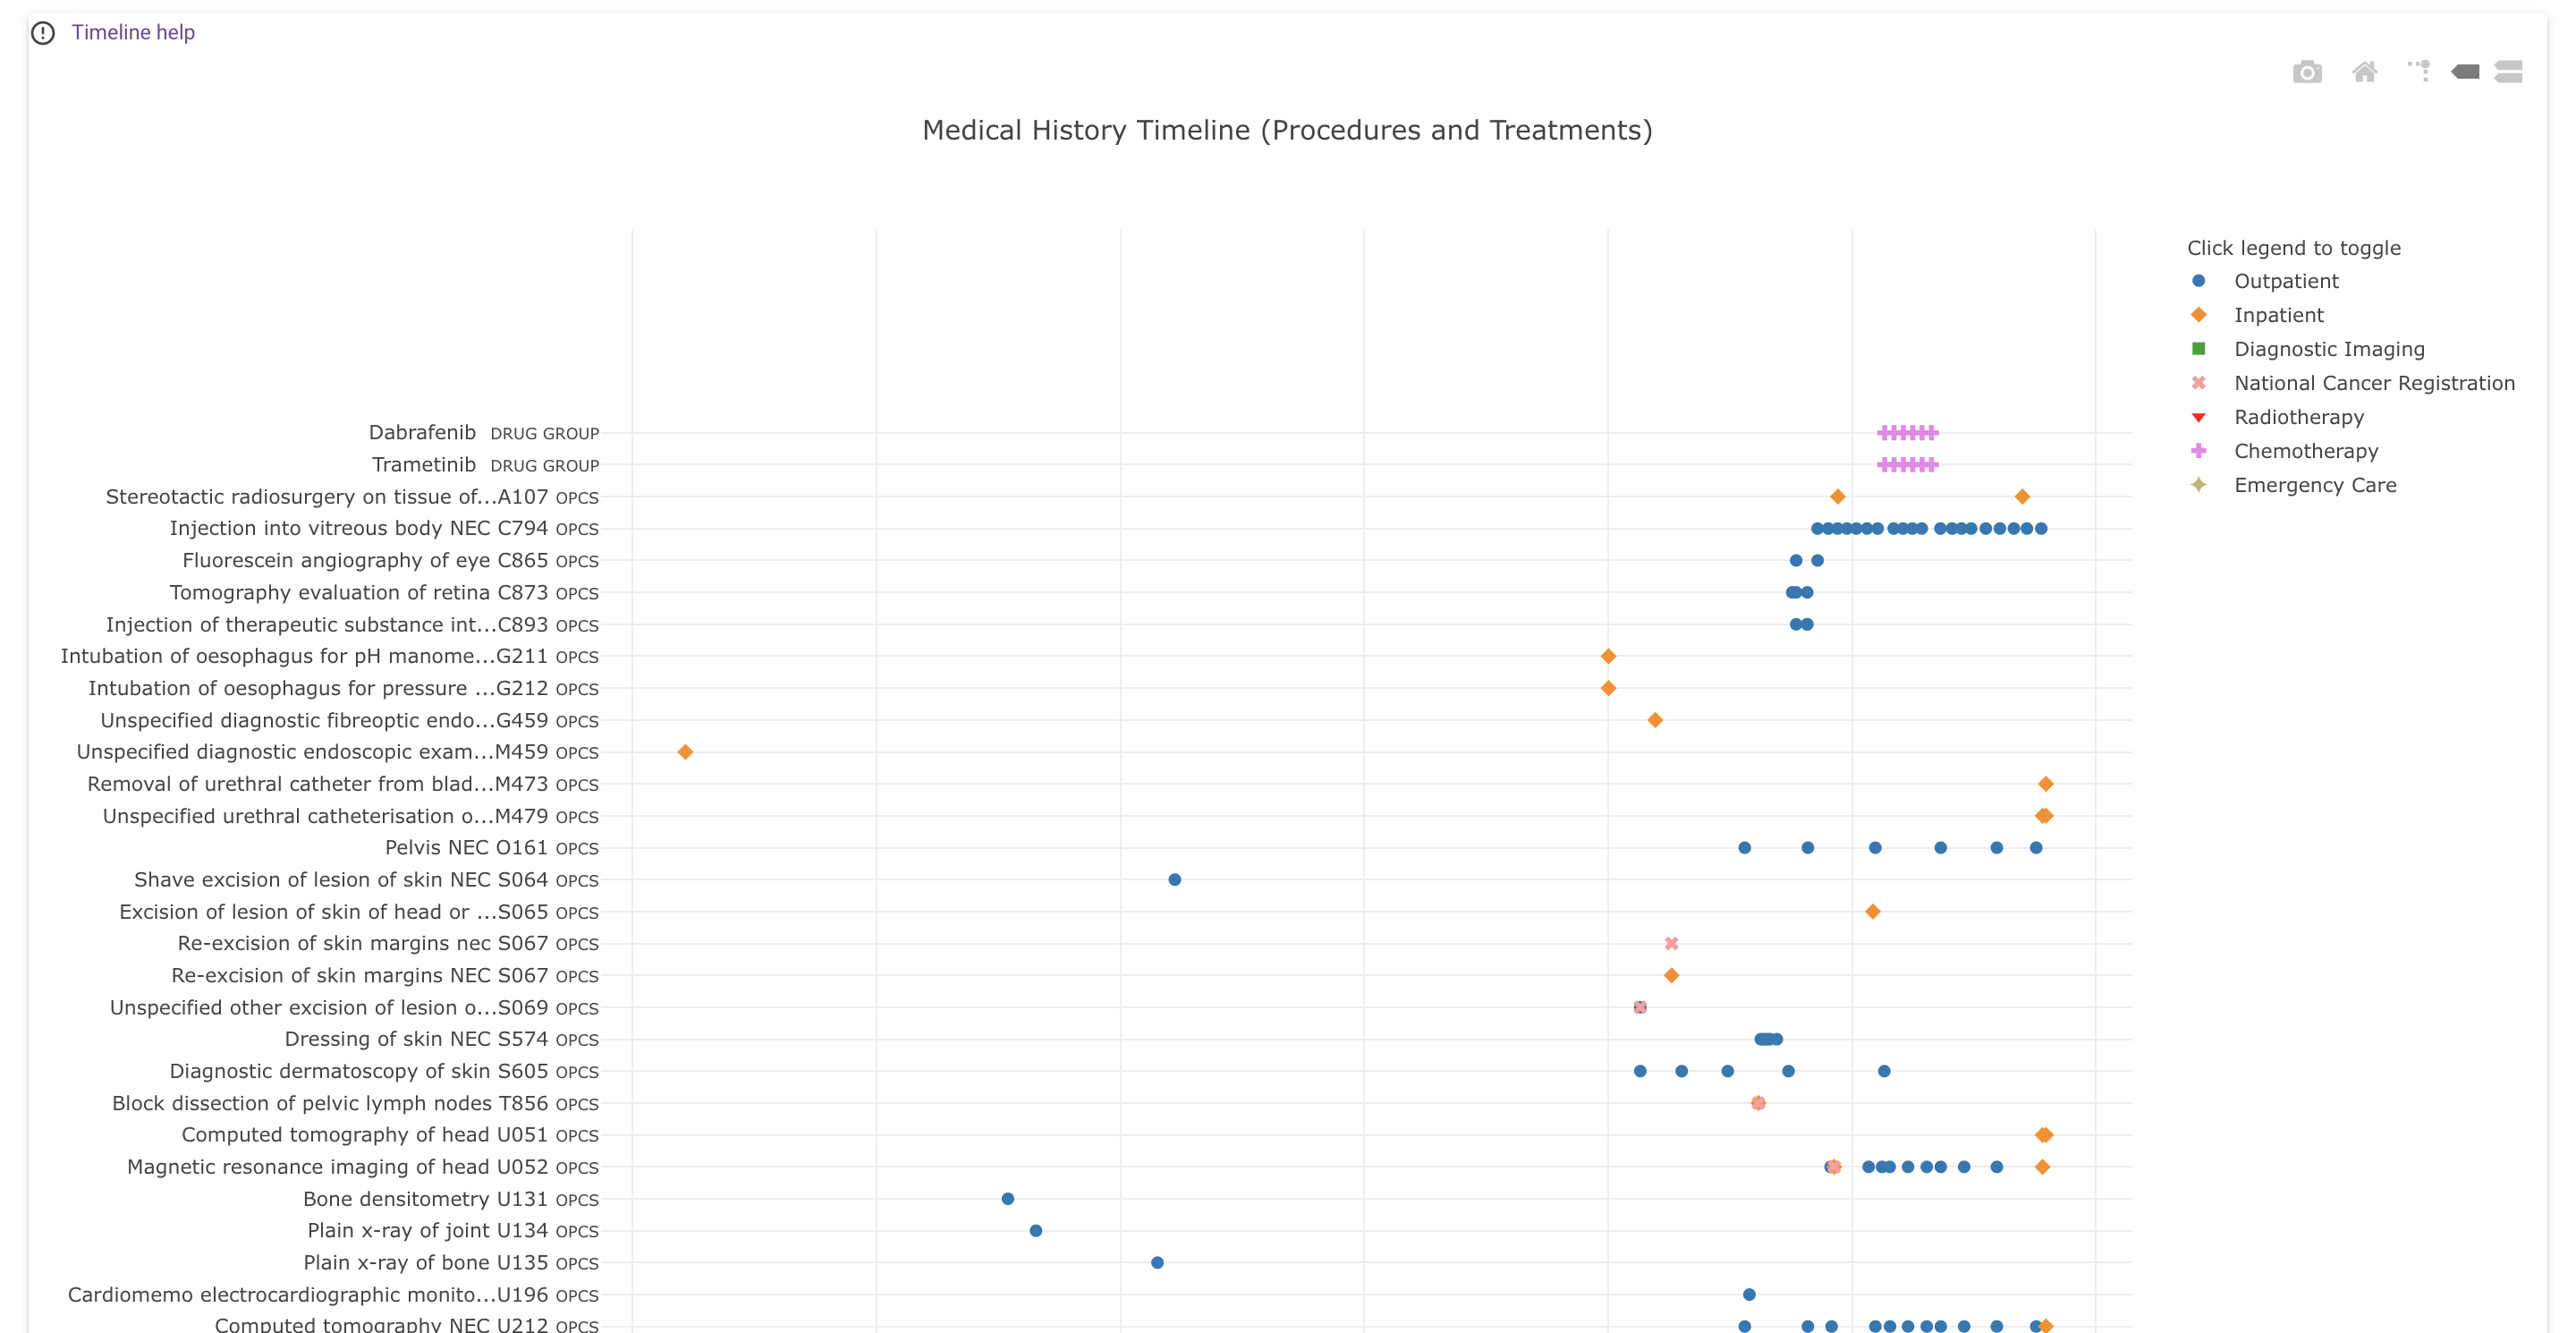
All available medical history details for the participant visualised in two charts; one for conditions and observations and one for procedures and treatments.
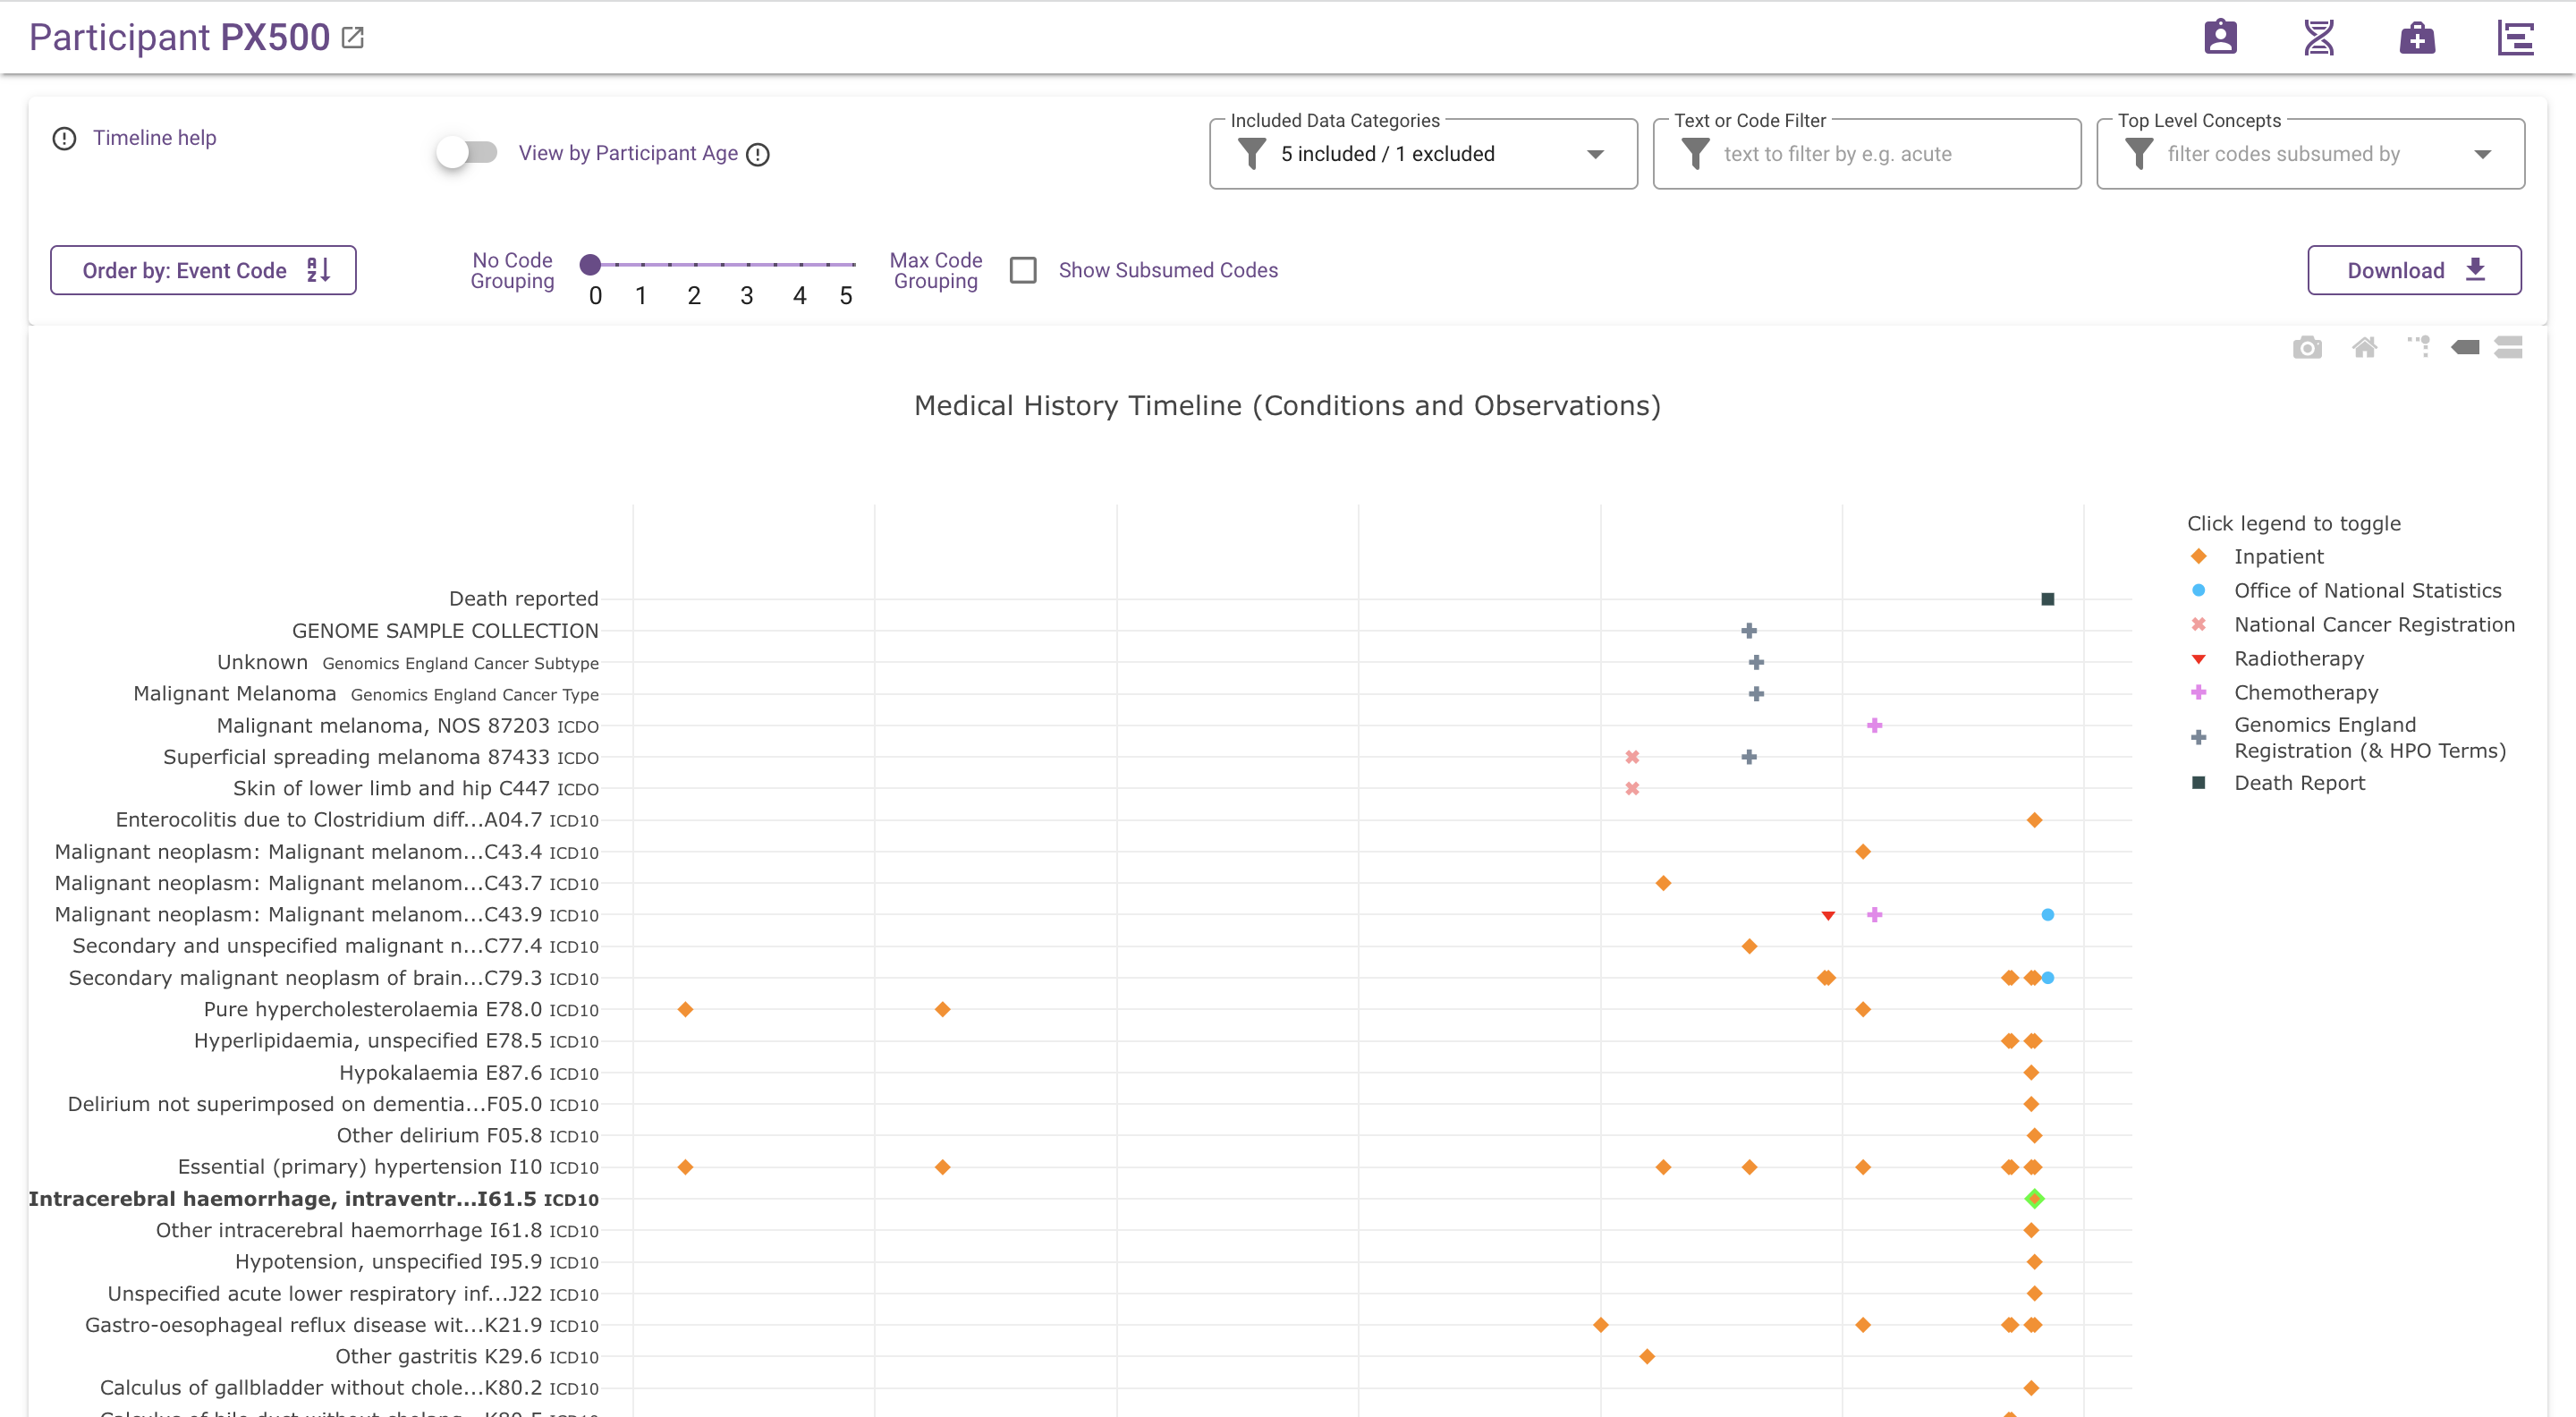
What does the chart show?
Each dot represents an event (such as a diagnosis, procedure or observation) in the participant's medical history. Different colours represent different data sources.
Time is represented on the x-axis, by default labeled with dates (this can be changed to approximate participant age, using the "View by Participant Age" switch, which is described below). Events are positioned at the start of the medical encounter they belong to; e.g. diagnoses made during an inpatient encounter are placed on the hospital admission date.
The vertical axis is used for event codes and descriptions and for grouping similar events together. By default, the displayed codes are the most specific codes available, i.e. the code with which the event is coded in the underlying data set. The code grouping slider, which is described in more detail below, can be used to "zoom out" from these detailed codes, by grouping related codes under their common ancestor codes according to the hierarchy in the applicable ontology or classification.
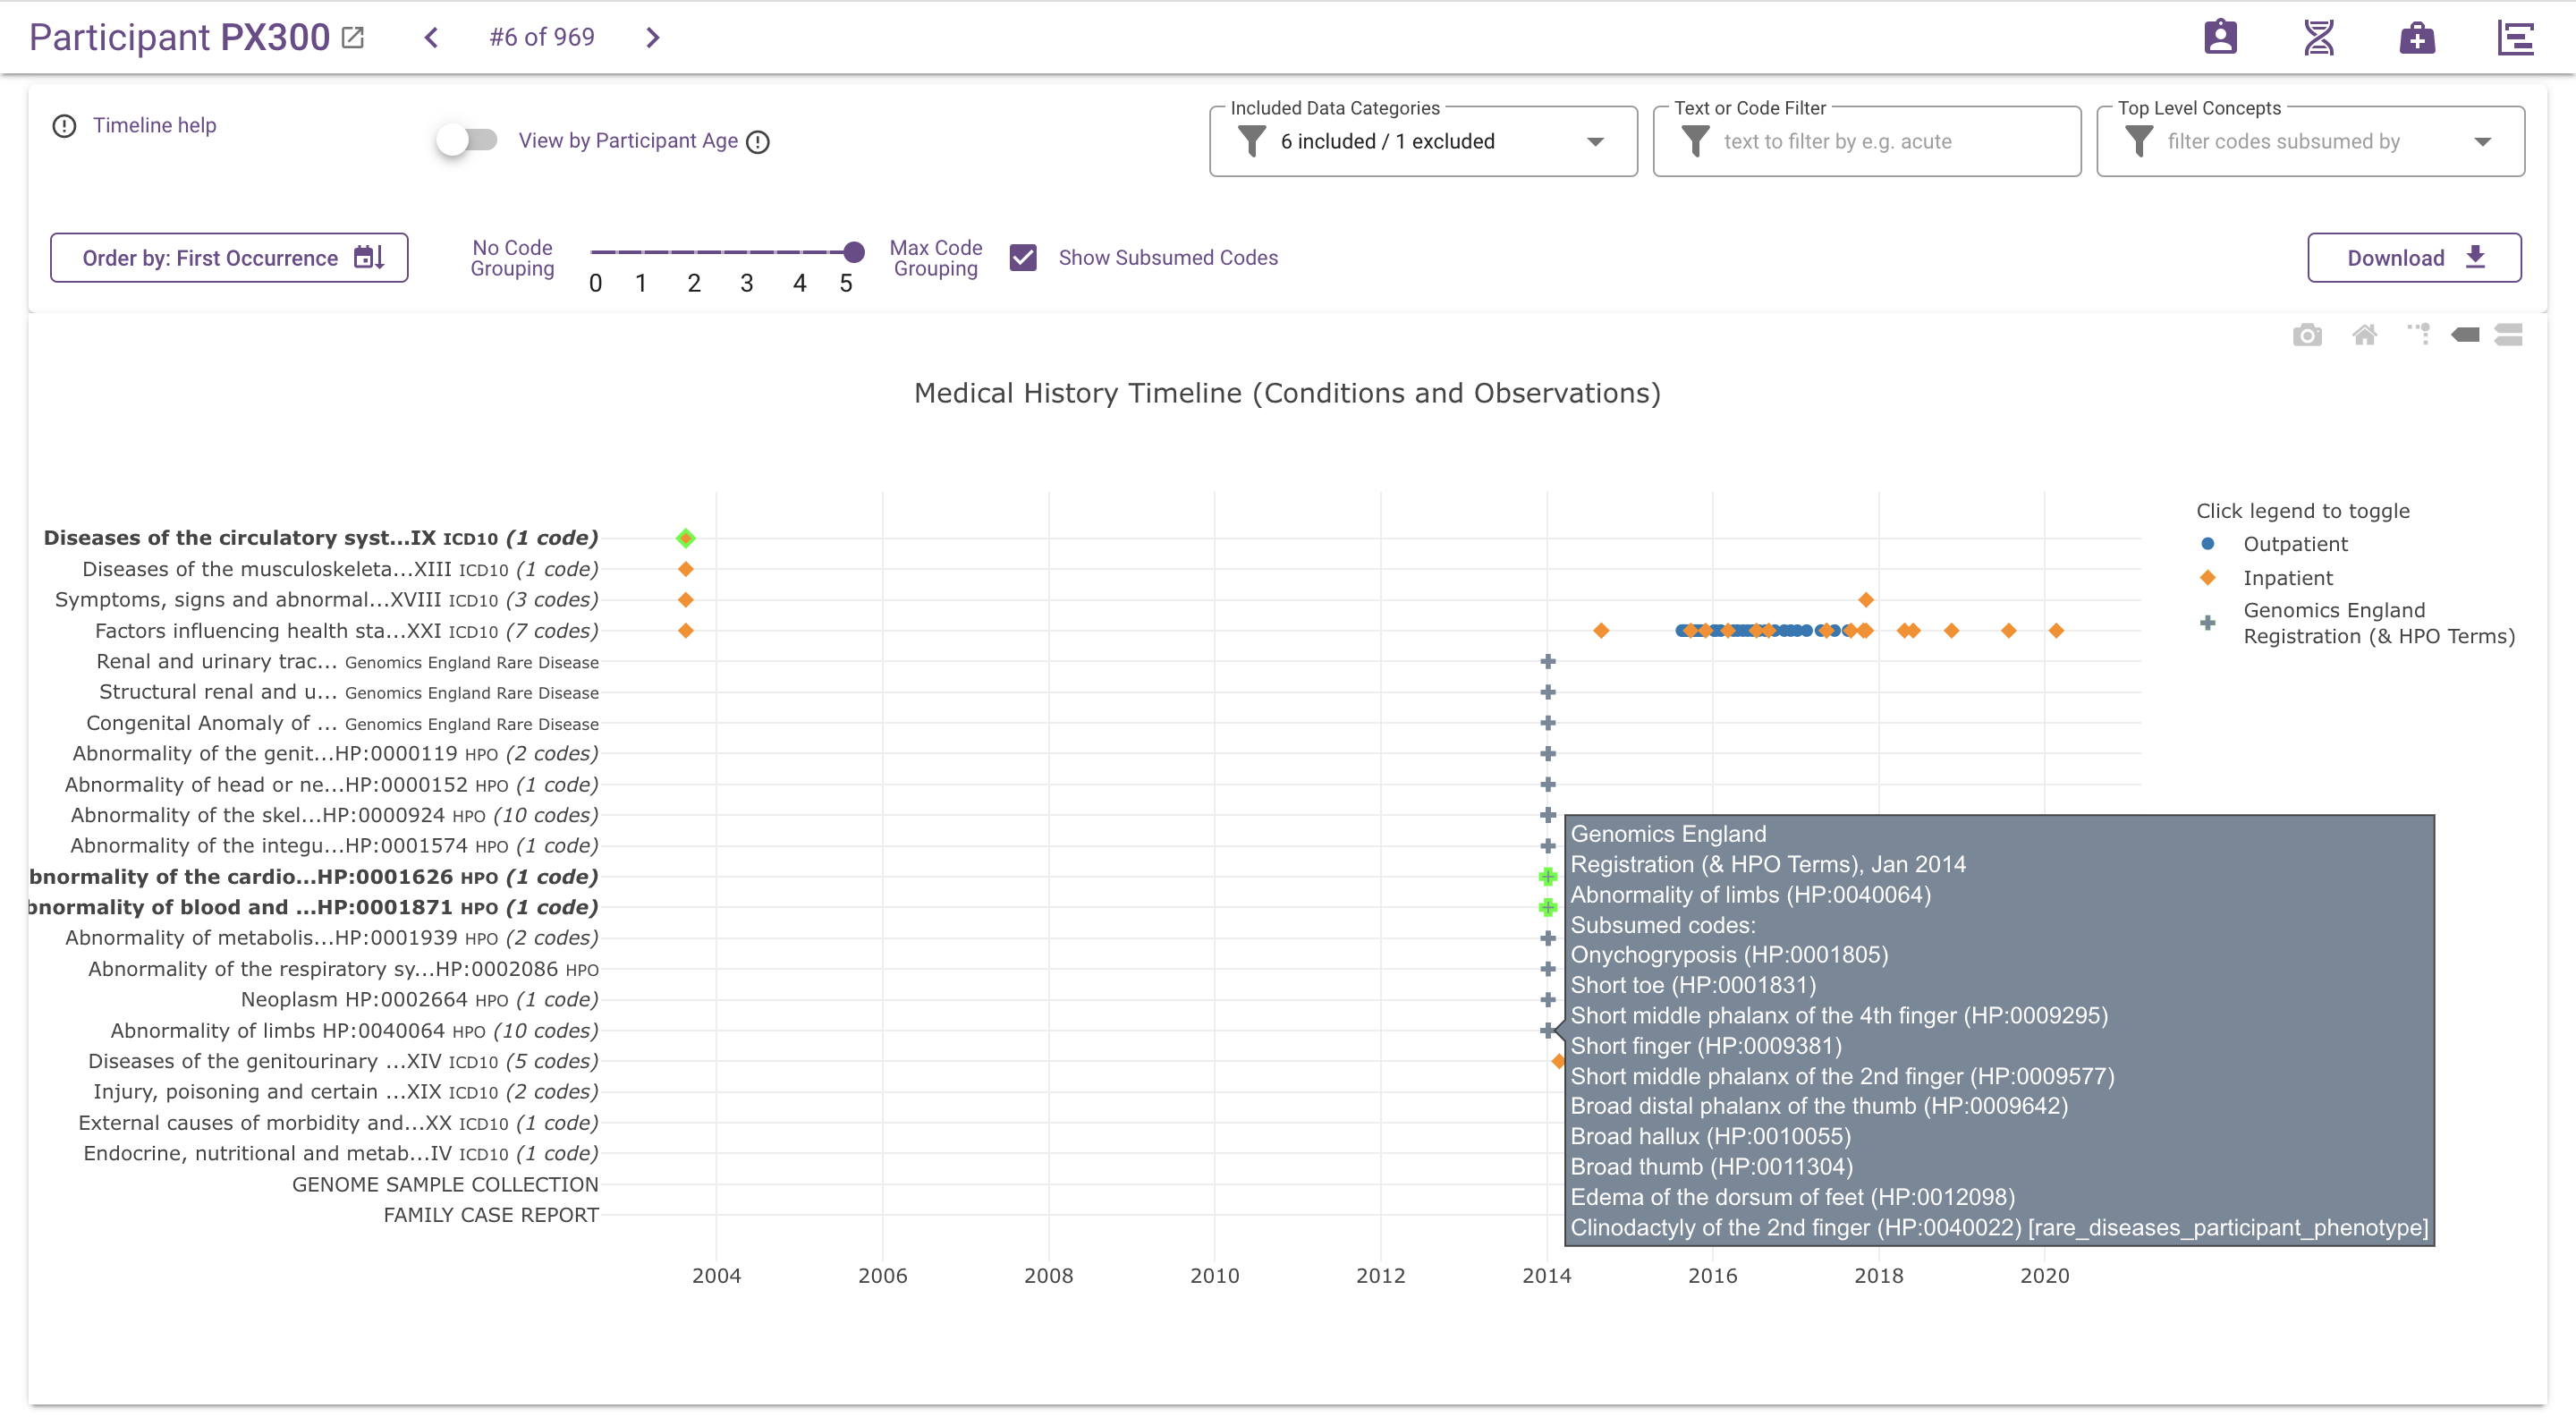
You can hover over each data point to see more details, such as the full code and description, date or age, subsumed codes (if applicable), stage details and the source table(s) of the data point.
Clicking on any data point opens the source table in Labkey in a new tab, filtered for that data point.
Stage values are visible as text markers above cancer diagnosis data points. If multiple stage values are available, the value with the highest display priority is shown: "Stage Best" > TNM Group/FIGO/Dukes > TNM components. All available values can be seen in the hover text.
The Timeline Help icon in the top-left will display a brief summary of the various timeline controls and filters available.
Legend and data series
Specific data series can be hidden by clicking on the corresponding row inside the legend.
Different data series represent different data sources as outlined in the table below. For more details on the data visible on the timeline, see the separate page on Data in the Participant Explorer.
| Label | Colour/Style | Source | Events |
|---|---|---|---|
| Inpatient | Orange | NHS HES | Diagnoses (ICD-10) and operations (OPCS) |
| Outpatient | Dark blue | NHS HES | Diagnoses (ICD-10) and operations (OPCS) |
| Emergency Care | Khaki | NHS ECDS | Diagnoses and treatments (SNOMED) |
| Mental Health Services | Dark red | NHS MHMDS | Diagnoses (ICD-10) |
| Diagnostic Imaging | Green | NHS DID | Imaging procedures (SNOMED) |
| Chemotherapy | Violet | NCRAS SACT | Cancer diagnoses (ICD-10), morphology (ICD-O-3 / SNOMED), staging (TNM) and treatments (OPCS) |
| Radiotherapy | Red | NCRAS RTDS | Cancer diagnoses (ICD-10) and treatments (OPCS) |
| Genomics England Referral and HPO Terms | Grey | 100kGP or NHS-GMS | Data collected at referral or registration: Recruited disease (100kGP), Clinical Indication (NHS-GMS), Sample Collection and Delivery, Family Case Report (exit or outcome questionnaires), phenotypes (HPO) and Cancer Tumour information at referral |
| National Cancer Registration | Salmon | NCRAS AV | Cancer diagnoses (ICD-10), morphology (ICD-O-3), staging ("Best", TNM, FIGO, Dukes) and treatments (OPCS) cancer diagnoses (ICD-10) |
| Office of National Statistics | Light blue | ONS Mortality | Underlying cause of death |
| Death Report | Black | ONS Mortality | Date of death |
| Cancer Staging | Text Marker | Various | Cancer stage markers above diagnoses |
Highlighting of events matching search criteria
When viewing participants in the search result after searching by clinical concept, codes that were part of the search criteria are indicated in the timeline by bold labels and light-green bordered data points. This includes subsumed codes, if applicable.
Chart and zoom controls
To zoom in on an area, left-click and select a rectangular area inside the chart.
The icons in the top-right corner have the following functions, from left to right:
- Camera: Download a snapshot of the chart in PNG format
- Home: reset axes (reset the zoom-level)
- Toggle Spike Lines: enable vertical and horizontal lines when hovering over data points
- Show closest data on hover: display details of a single data point when hovering (enabled by default)
- Compare data on hover: display details of multiple data points from different series on the same date. This can be useful to find related data points in multiple series.
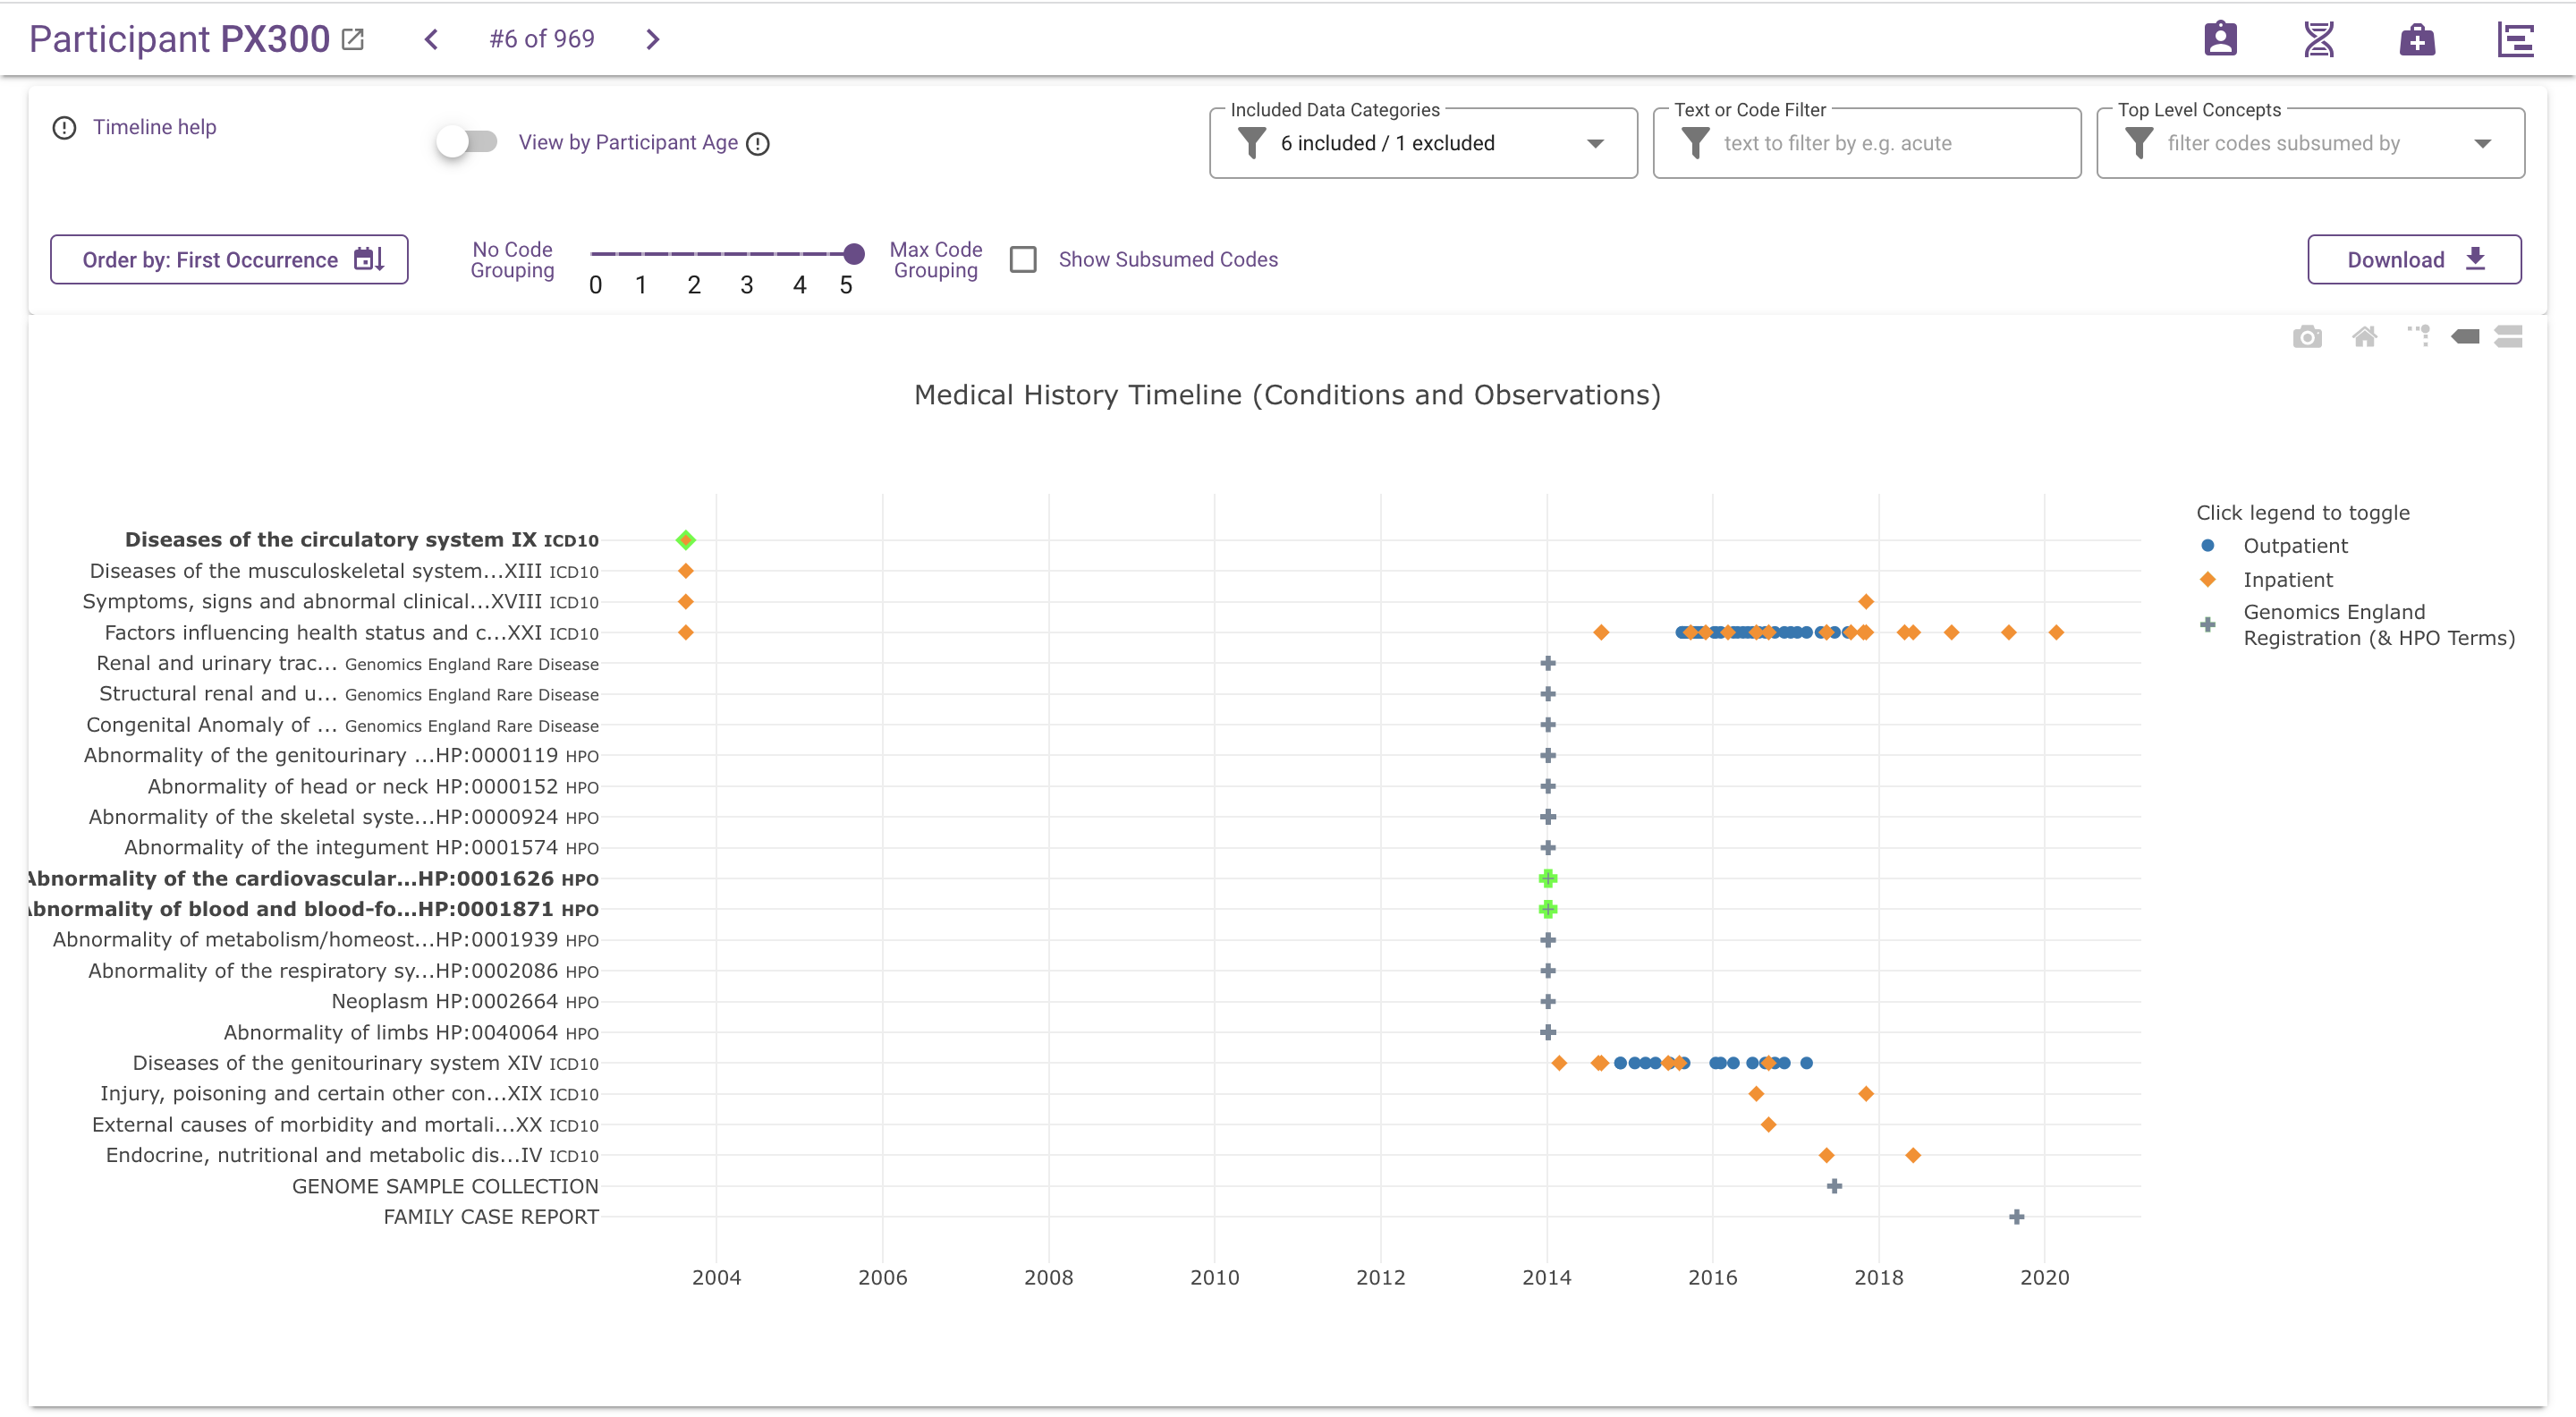
Vertical ordering
The "Order by" button toggles the vertical ordering of event codes between three options:
- Event code, ascending (default)
- Date of first occurrence, ascending
- Date of last occurrence, descending
View by participant age switch
Replaces the date labels on the x-axis with approximate participant age. Age is calculated from the year of birth, by taking January 1st as the date of birth, and is therefore only an approximation of the real age.
Included data categories filter
The Data Categories filter can be used to hide one or more of the broad categories of events defined in the table below. By default, all categories are visible except for "Misc. unknown" codes.
| Category | Includes |
|---|---|
| Misc. unknown or "noisy" coded events | Codes: * ICD-10 R69: Unknown or unspecified causes of morbidity * OPCS X997: Not known * OPCS X662: Assessment by multiprofessional team NEC * OPCS X663: Assessment by multidisciplinary team NEC * SNOMED CT 413334001: Patient given written advice |
| Genomics England related events | 100,000 Genomes project events: * Date sample taken for sequencing * Rare diseases family case report date |
| Body site codes | Body site codes associated with conditions, observations and procedures. Body site codes are assigned according to the data mapping, but effectively this includes OCPS site-of-operation codes, ICD-O-3 topography codes and SNOMED CT body structure hierarchy codes. |
| HPO terms | 100,000 Genomes project registered phenotypes |
| Recruited Disease | 100,000 Genomes project recruited disease |
| Conditions and Observations | Condition and observation codes (except recruited diseases, HPO terms and body site codes) |
| Procedures and Treatments | Procedure codes (except body site codes) |
| Cancer Staging | Cancer stage observations and text markers above diagnoses |
Text or code filter
The text or code filter narrows down the visible events through a case-insensitive substring search on event codes and descriptions, including the short code system name, stage details and source table name. Examples:
- "lung": to only see events with "lung" in the description
- "icd10": to only see ICD-10 coded events
- "stage": to only see conditions/observations with stage details
- "av_tumour": to only see data that originates from the av_tumour table
Top level concepts filter
The top level concepts filter can be used to narrow down the visible events to those that are subsumed by one or more high level clinical concepts, following the hierarchy information available in the code systems ICD-10, OPCS, SNOMED CT and HPO. For ICD-10 and OPCS these are the Chapters, e.g. "ICD-10 Chapter IV: Diseases of the nervous system". For SNOMED CT and HPO, these are the concepts two and three levels, respectively, below the root concept. For example, "SNOMED Procedure by Site" and "HPO Abnormality of the nervous system".
The filter only lists top level concepts for which at least one data point is available.
By default, no top level concepts are selected and no events will be filtered out. Selecting one or more concepts will retain only events with codes below (i.e. subsumed by) the selected concepts.
The top level concepts correspond to the codes displayed on the y-axis when the code-grouping slider is set to five (max). In that case, you may find that the y-axis still displays more concepts than the ones selected in the top level concepts filter, because SNOMED CT and HPO codes that pass the filter can have more ancestors than the ones used for filtering.
Code grouping slider 
By default, the y-axis displays the actual codes that are found in the data set, which are the most specific codes available. This level of detail may not be helpful when viewing a participant with large numbers of related but slightly different events or when looking for commonalities across different participants. For example, when viewing ICD-10 codes on the timeline, you may wish to ignore the 4th digit and group events by their 3-digit codes. Or similarly, you may wish to group relatively fine-grained HPO terms under their more generic ancestor terms.
The code grouping slider can be used to decrease the granularity of the y-axis by grouping similar events together under common ancestor codes, using the hierarchy information provided by the relevant classification or ontology (ICD-10, OPCS, SNOMED CT and HPO). The main effect is that events with different codes can be combined under a common term and displayed on the same row in the chart:
For ICD10 and OPCS codes, this will always result in fewer rows, because codes only have a single parent. For SNOMED CT and HPO, this process may also result in more rows, because codes often have multiple parents.
The slider allows to fine-tune the y-axis to the desired level of abstraction. Moving the slider from left to right decreases the maximum depth in the hierarchy at which codes will be displayed. Codes that exceed the threshold depth will be represented by their ancestor code(s) at the threshold depth instead, thereby increasing the level of abstraction. The exact correspondence of slider position to maximum depth in the hierarchy (which is calibrated for different code systems to compensate for differences in granularity and depth) is explained in the tables below.
| Slider position | ICD-10 Max display depth | Displayed ICD10 code for source code N18.4 | HPO Max display depth | Displayed HPO term(s) for source code HP:0012626 |
|---|---|---|---|---|
| 0 | 5 | N18.4 Chronic kidney disease, stage 4 | 13 | HP:0012626 Stage 4 chronic kidney disease |
| 0.5 | 4 | N18.4 Chronic kidney disease, stage 4 | 12 | HP:0012626 Stage 4 chronic kidney disease |
| 1 | 4 | N18.4 Chronic kidney disease, stage 4 | 11 | HP:0012626 Stage 4 chronic kidney disease |
| 1.5 | 3 | N18.4 Chronic kidney disease, stage 4 | 10 | HP:0012626 Stage 4 chronic kidney disease |
| 2 | 3 | N18.4 Chronic kidney disease, stage 4 | 9 | HP:0012626 Stage 4 chronic kidney disease |
| 2.5 | 2 | N18 Chronic kidney disease | 8 | HP:0012622 Chronic kidney disease |
| 3 | 2 | N18 Chronic kidney disease | 7 | HP:0000083 Renal insufficiency |
| 3.5 | 1 | N17-N19 Renal failure | 6 | HP:0012211 Abnormal renal physiology HP:0000077 Abnormality of the kidney |
| 4 | 1 | N17-N19 Renal failure | 5 | HP:0011277 Abnormality of the urinary system physiology HP:0010935 Abnormality of the upper urinary tract |
| 4.5 | 0 | XIV Diseases of the genitourinary system | 4 | HP:0000079 Abnormality of the urinary system |
| 5 | 0 | XIV Diseases of the genitourinary system | 3 | HP:0000119 Abnormality of the genitourinary system |
| Slider position | OPCS Max display depth | Displayed OPCS code for source code U117 | SNOMED Max display depth | Displayed SNOMED term(s) for source code 431508007 |
|---|---|---|---|---|
| 0 | 5 | U117 Magnetic resonance angiography | 12 | 431508007 MR angiography of entire blood vessel |
| - | 4 | U117 Magnetic resonance angiography | 11 | 431508007 MR angiography of entire blood vessel |
| 1 | 4 | U117 Magnetic resonance angiography | 10 | 431508007 MR angiography of entire blood vessel |
| - | 3 | U117 Magnetic resonance angiography | 9 | 431508007 MR angiography of entire blood vessel |
| 2 | 3 | U117 Magnetic resonance angiography | 8 | 431508007 MR angiography of entire blood vessel |
| - | 2 | U11 Diagnostic imaging of vascular system | 7 | 431508007 MR angiography of entire blood vessel |
| 3 | 2 | U11 Diagnostic imaging of vascular system | 6 | 241663008 Magnetic resonance imaging (MRI) of vessels |
| - | 1 | U01–U21 Diagnostic Imaging | 5 | 113091000 Magnetic resonance imaging 77343006 Angiography |
| 4 | 1 | U01–U21 Diagnostic Imaging | 4 | 363679005 Imaging 118672003 Procedure on cardiovascular system 118804001 Procedure on blood vessel 276341003 Cardiovascular investigation 414457001 Imaging of soft tissue |
| - | 0 | U CHAPTER U DIAGNOSTIC IMAGING, TESTING AND REHABILITATION (CODES U01-U54) | 3 | 386053000 Evaluation procedure 118664000 Procedure on body system 118717007 Procedure on organ 118738001 Procedure on soft tissue 371571005 Imaging by body site |
| 5 | 0 | U CHAPTER U DIAGNOSTIC IMAGING, TESTING AND REHABILITATION (CODES U01-U54) | 2 | 128927009 Procedure by method 362958002 Procedure by site |
Show subsumed codes
When code grouping is active, the y-axis and data point hover information only display the ancestor codes and descriptions. Information about which source codes are grouped under each ancestor code is hidden by default, to avoid unnecessary noise in the visualisation. If desired, this information can be added by ticking the Show Subsumed Codes checkbox. The number of source codes subsumed by each ancestor code is added to the label on the y-axis, and code and description of subsumed codes are added to the data point hover information:
Download
Click on the Download button to download the data points on the timeline as a TSV file.
Filters also restrict the data points included in the download.
Zooming and toggling data series by clicking in the legend do not affect the contents of the download.
The code grouping slider also does not affect the download, except when comparing multiple participants and code grouping acts as a filter in combination with the "shared codes" threshold.
| Column | Notes |
|---|---|
| participant_id | the participant ID |
| year_of_birth | the participant year of birth |
| event_date | the date of the event |
| clinical_concept_type | indicates whether the event is a condition, observation or procedure |
| code_system | the short name of the classification or ontology used to code the event |
| code | the event code |
| description | the event description |
| source_table | the name of the source table in LabKey |
| encounter_type | the encounter type (indicator of the data source - see Data in the Participant Explorer for the mapping from source data to encounters) |
If "Cancer Staging" is selected in the "Included Data Categories" filter, the following additional columns are included:
| Column | Notes |
|---|---|
| stage_best | "Stage Best" (NCRAS) |
| stage_best_system | the staging system used for stage_best (NCRAS) |
| t_stage | the T stage category |
| n_stage | the N stage category |
| m_stage | the M stage category |
| tnm_stage_group | the TNM stage group |
| figo | the FIGO stage |
| dukes | the Dukes stage |
The availability of stage values depend on the source table of the diagnosis data point. See Data in the Participant Explorer for more details.