AggV2 site QC, FILTER and INFO Fields
For all variants in AggV2, we apply a number of quality control (QC) metrics. These metrics are all flagged in the INFO column on the VCF. Variants that pass quality control are listed as PASS in the FILTER column. We do not remove any variants from these files, even if they do not pass quality control.
Multi-allelic variants are decomposed using vt. This means that multiallelic SNPs will have a biallelic representation, and that the corresponding site metrics are allele (or row) specific. In this document, any counts we give of variants are of these biallelic representations.
Across the autosomes, our dataset comprises 722,342,407 variants, of which 540,098,760 (74.8%) pass our site QC metrics.
Site QC of the autosomes
The flags are presented within the FILTER column of the multi-sample VCF files and the annotation files as follows:
| FILTER TAG | Description |
|---|---|
PASS |
All filters passed |
missingness |
Missingness (fully missing genotypes with DP=0) ≤ 5% |
depth |
Median Depth ≥ 10 |
GQ |
Median GQ ≥ 15 |
ABratio |
Percentage of het calls not showing significant allele imbalance for reads supporting the ref and alt alleles ≥ 25% |
completeGTRatio |
Percentage of complete sites (sites with no missing data) ≥ 50% |
phwe_eur |
mid p-value for deviations from HWE in unrelated samples of inferred European ancestry ≥ 1e-5 |
If a variant fails, the reason will be listed in the FILTER field.
For more detail into how the metrics were calculated, please see the INFO field information below.
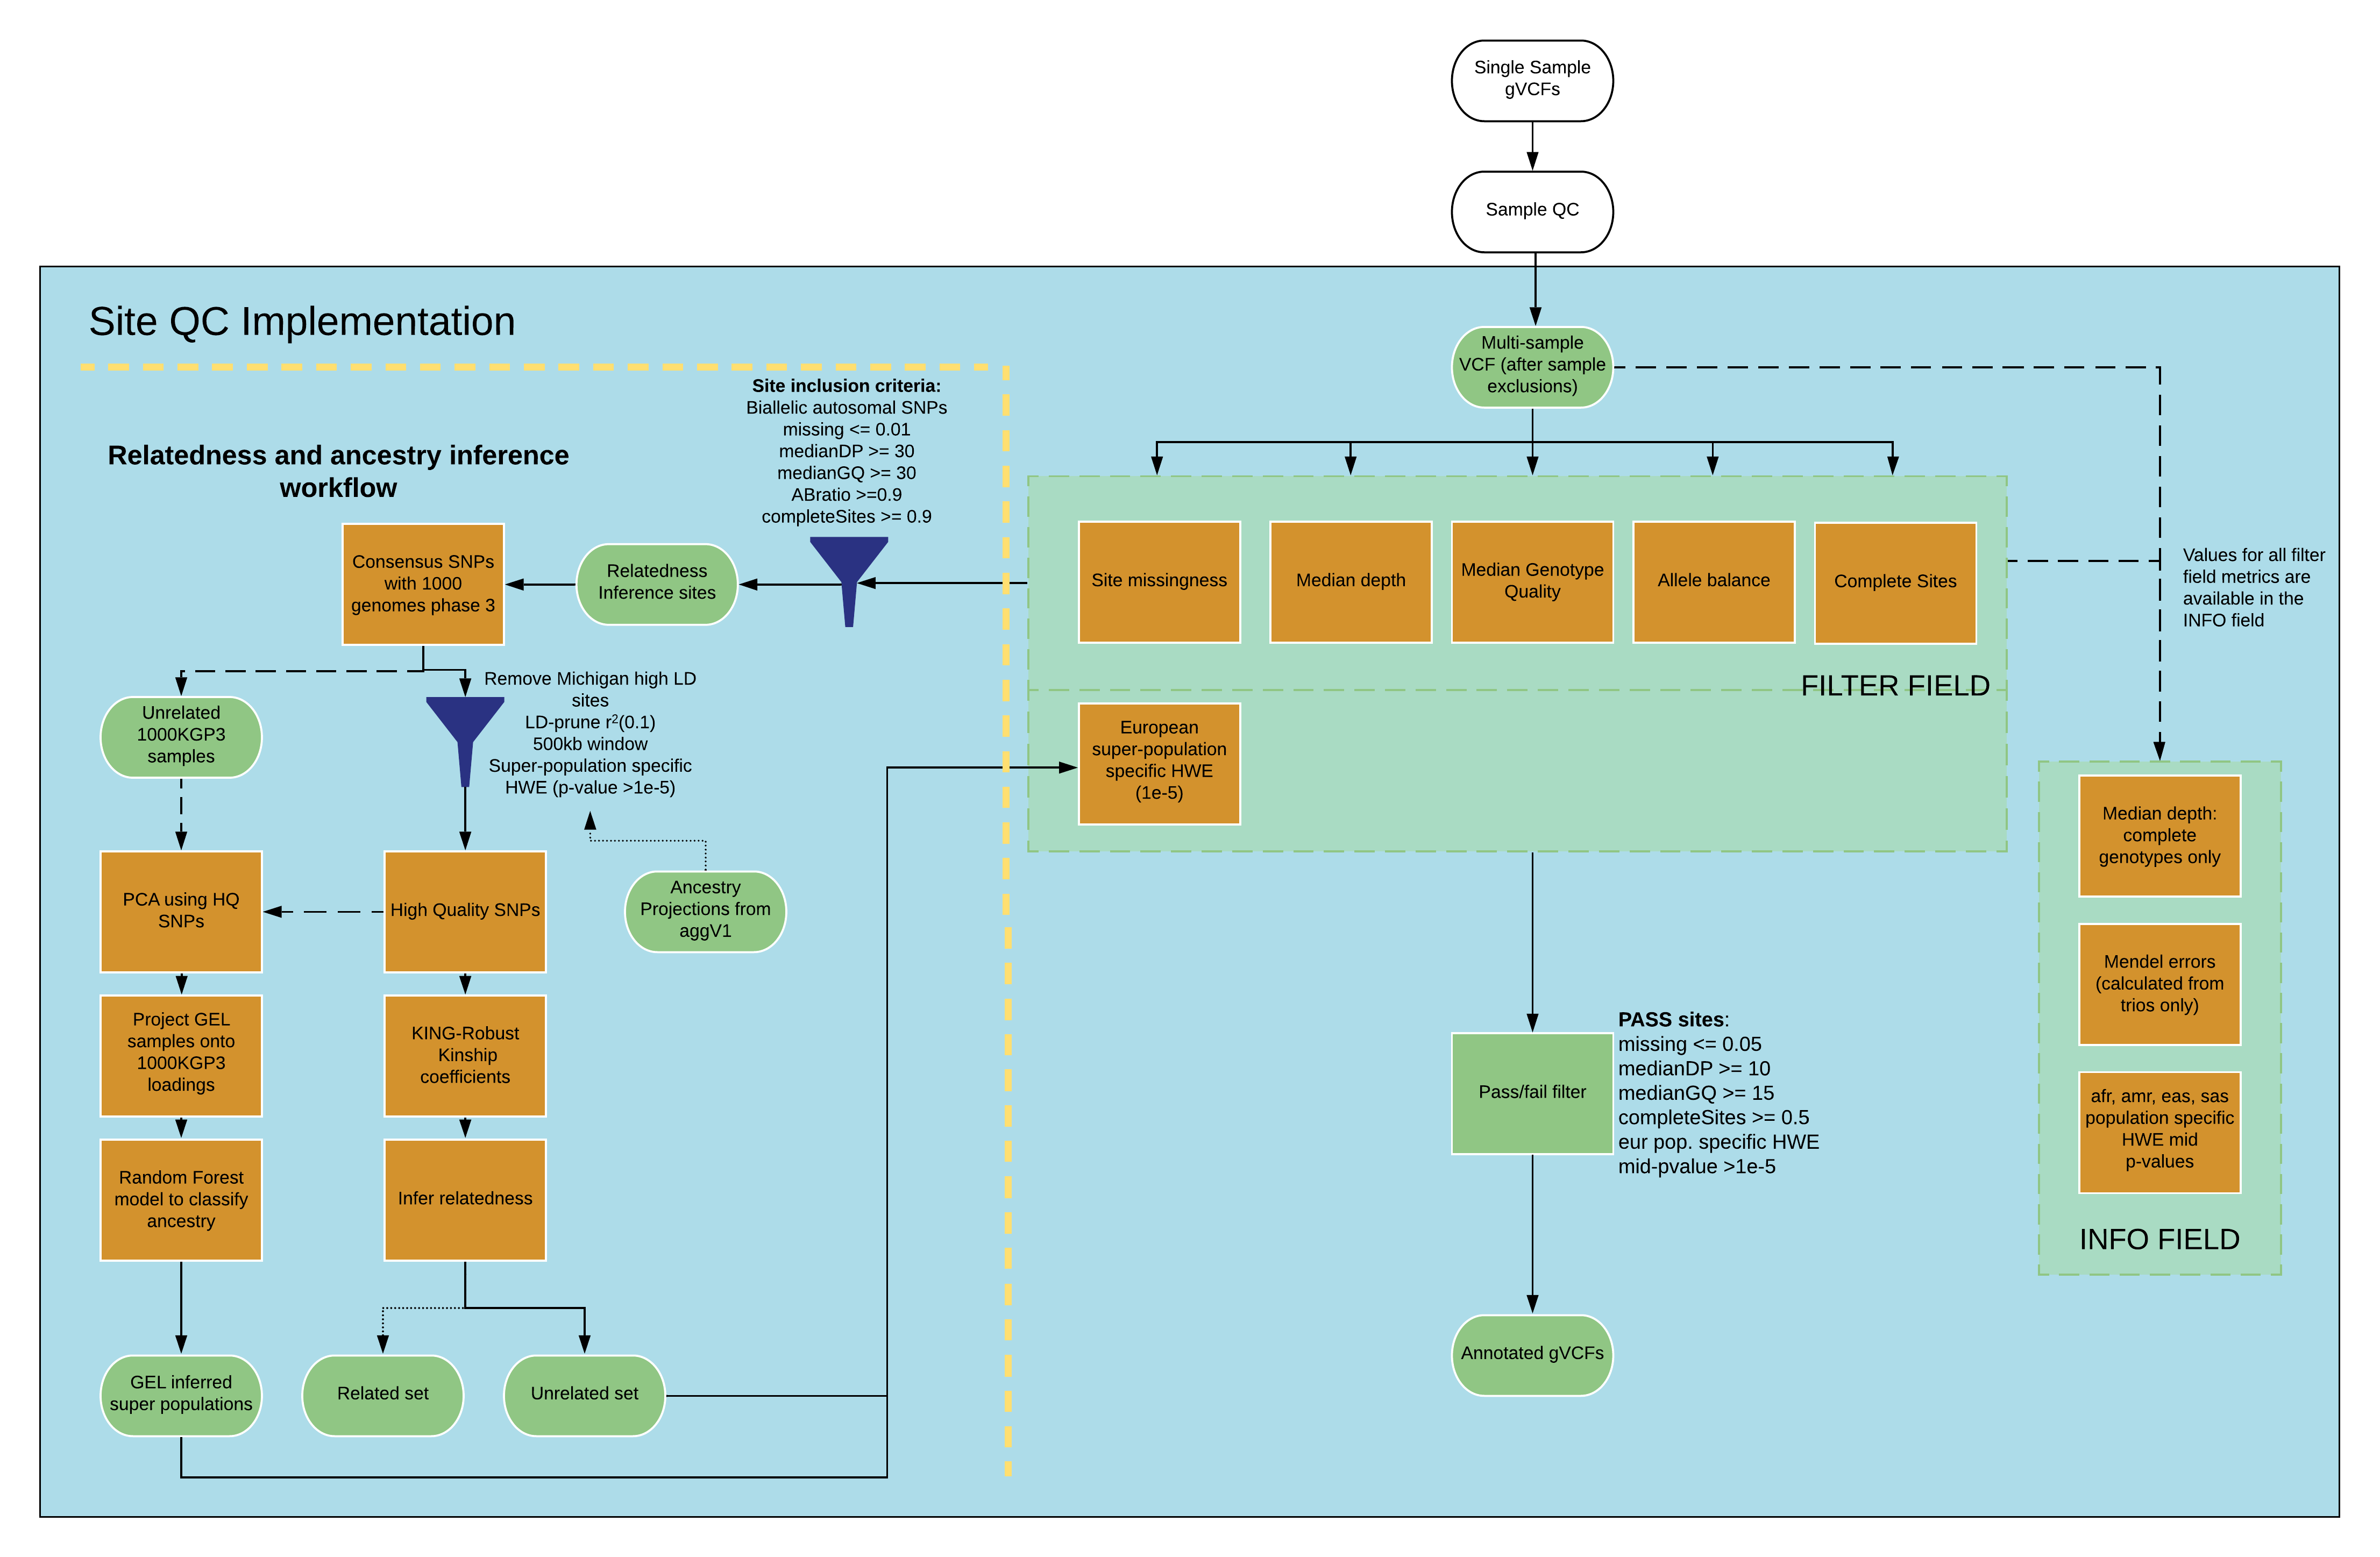
Schematic of the site QC pipeline
Site QC statistics
The overall number of variants and PASS variants across autosomes is shown below.
| Data | Description | N | of which PASS | % (PASS) |
|---|---|---|---|---|
| All | all SNPs and INDELs (decomposed into their biallelic representation) | 722342407 | 540098760 | 74.8 |
| Biallelic Indels | Insertions or deletions where there is only allele in our dataset | 37845656 | 33101705 | 87.5 |
| All Indels | Insertions or deletions with one or more ALT alleles (decomposed into their biallelic representation) | 91374494 | 62951477 | 68.9 |
| Biallelic SNPs | SNPs with only one allele in our dataset | 400287362 | 382769040 | 95.6 |
| All SNPs | SNPs with one or more ALT alleles (decomposed into their biallelic representation) | 630967910 | 477965057 | 75.8 |
The reduced rates of PASS variants across all SNPs and Indels are an outcome of the decomposition of multiallelic variants to their bialellic representations. Full descriptions of site representations can be found here.
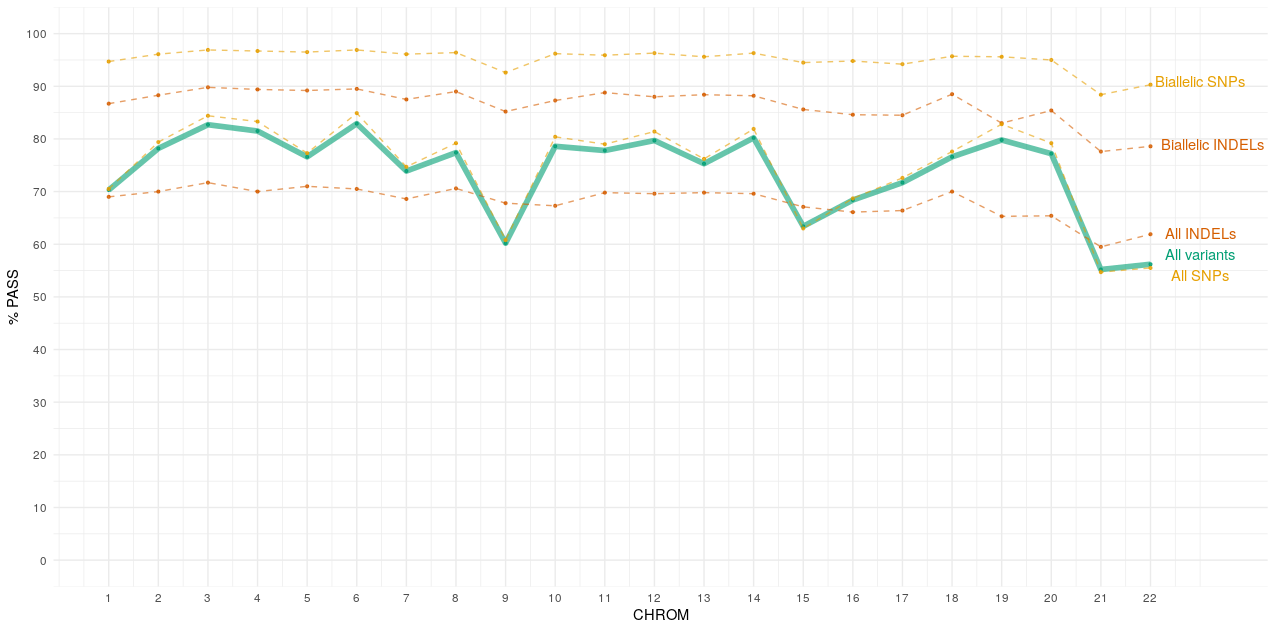
Chromosome specific pass rates
Below is a plot showing the percentage of PASS variants per chromosome (autosomes only).
INFO field
Per variant quality metrics were calculated and populated in the INFO field of the multi-sample VCF files and the annotation files.
| Metric TAG | INFO description | Used for FILTER field calculation | Further Description |
|---|---|---|---|
medianDepthAll |
Median depth (taken from the DP FORMAT field) of all samples | Y | |
medianDepthNonMiss |
Median depth (taken from the DP FORMAT field) from samples with non-missing genotypes | N | The median depth was calculated from GTs in which partially or fully missing genotypes were filtered out. This is included as an INFO field metric only. Values are capped at 99.bcftools query $infile -e 'GT~"\."' [...] |
medianGQ |
Median genotype quality(taken from the GQ FORMAT field) from samples with non-missing genotypes | Y | The median GQ was calculated from GTs in which partially or fully missing genotypes were filtered out. Values are capped at 99.bcftools query $infile -e 'GT~"\."' [...] |
missingness |
Ratio of fully missing genotypes ( (GT = './.' and DP = 0) | Y | |
completeSites |
The ratio of complete GTs/total number of Samples | Y | As we decompose multiallelic variants into biallelic representations, minor allele genotypes may be largely composed of half missing genotypes ('./1 |
ABratio |
For each het call, a binomial test is conducted for reads supporting the ref and alt alleles. AB ratio is the hets showing imbalance (p<0.01) divided by the total number of hets. | Y | The AB ratio is a measure of the evidence supporting whether a heterzygous call is correct or not. This is achieved by testing the distribution of reads supporting ref and alt alleles for each genotype. We apply a binomial test with a stringent threshold of p-value >0.01. The ratio is number of heterozygous calls passing this test divided by the total number of heterozygous calls for a variant. |
| MendelSite | Number of Mendelian errors at this site from confirmed trios only | N | Site wide Mendelian errors are given as an info field metric. These are calculated using confirmed trios, with trios harbouring excess family-wise Mendelian errors filtered out. |
phwe_afr |
HWE mid p-value in inferred unrelated inferred afr superpop | N | Hardy Weinberg Equilibrium scores are calculated using inferred unrelated inferred super-population (based on the 1000 genomes) groups with a threshold of >1e-5 (mid-p value). Due to the large number of inferred Europeans within our dataset, we use this for the filter field. Anyone studying other super-populations may wish to choose the relevant super-population p-value. |
phwe_amr |
HWE mid p-value in inferred unrelated inferred amr superpop | N | as above |
phwe_eas |
HWE mid p-value in inferred unrelated inferred eas superpop | N | as above |
phwe_eur |
HWE mid p-value in inferred unrelated inferred eur superpop | Y | as above |
phwe_sas |
HWE mid p-value in inferred unrelated inferred sas superpop | N | as above |
AN |
Total number of alleles in called genotypes | N | These values are all calculated using the BCFtools plugin fill-tags |
AC |
Allele count in genotypes | N | as above |
AC_Hom |
Allele counts in homozygous genotypes | N | as above |
AC_Het |
Allele counts in heterozygous genotypes | N | as above |
AC_Hemi |
Allele counts in hemizygous genotypes | N | as above |
Missingness and completeness
Due to the decomposition of multiallelic variants with vt, some of the samples will have partially or completely missing genotype data (e.g. ".", "0/." or "./.") without data being truly missing for that sample at that locus.
For instance, a sample with genotype TT for the multiallelic variant A/C/T will have missing ("./.") genotype for the A/C variant in its bi-allelic representation, but have 1/1 for the A/T bi-allelic representation. Both of the aforementioned representations will be present in the final aggV2 file, in separate rows.
To distinguish this from a truly missing genotype, we include completeness. Missingness will count truly missing sites (with depth of 0) while completeness will indicate the percentage of samples with complete (0/0, 0/1, 1/1) genotype data for that variant. In the example of the sample with genotype TT above, it will be not counted as missing but it will not be counted as complete either. Low completeness and low missingness for a variant will hence often indicate a variant where the respective alt allele is rare, in a decomposed multiallelic site.
Site QC of the X chromosome
Sex chromosome QC was handled in a similar manner to autosomal QC, however input files were split into male and female specific subsets which were analysed separately. This means that a PASS variant on chromosome X passes the same thresholds as any autosomal variant. Sex was determined on the basis of the Illumina ploidy data, with non-ambiguous XX and XY calls samples used to create the female and male subsets respectively. The files containing these data are available at:
/gel_data_resources/main_programme/aggregation/aggregate_gVCF_strelka/aggV2/additional_data/sample_sex/
Site QC was run using data on:
- 40,653 XX females
- 35,822 XY males
Samples of ambiguous ploidy were not included for the site QC calculations (although their data are still available within the aggregate).
The pass metrics were the same as for the autosomes for both male and female subsets in pseudo-autosomal regions (PAR). Non-PAR and PAR region site metric cut-offs are displayed in the table below:
| Metric | Females (non-PAR) | Males (no-PAR) | Females (PAR) | Males (PAR) |
|---|---|---|---|---|
Median depth |
≥10 | ≥5 | ≥10 | ≥10< |
Median GQ |
≥15 | ≥15 | ≥15 | ≥15< |
Percent missing |
≥5% | ≥5% | ≥5% | ≥5%< |
AB Ratio |
≥0.25 | NA | ≥0.25 | NA |
Mendel Errors |
Same as autosome (INFO) | Same as autosome (INFO) | Same as autosome (INFO) | Same as autosome (INFO)< |
Complete sites |
≥50% | ≥50% | ≥50% | ≥50% |
pHWE |
Same as autosome | NA | Same as autosome | NA |
Chrom X PASS variants are assessed according to their values in female samples only.
If you wish to filter for PASS variants in both male and females, then use the -i flag in BCFtools to filter for variants for which INFO/FILTER_m is PASS_m
INFO field data are presented in the same way as for the autosomes. Metrics with an '_m' suffix refer to males, and metrics with no suffix refer to females values. The exception to this is the AC, AN, AC_Hom, AC_Het, and AC_Hemi tags, which are presented as with an '_f' suffix for XX females, an '_m' suffix for XY males, and no suffix for all data.
| Variant type | Sex | N total | N pass | % pass |
|---|---|---|---|---|
| All | F | 31443093 | 22854984 | 72.7 |
| Biallelic INDELs | F | 1496167 | 1327705 | 88.7 |
| All INDELs | F | 3596716 | 2612302 | 72.6 |
| Biallelic SNPs | F | 17471739 | 16696725 | 95.6 |
| All SNPs | F | 27846377 | 20242682 | 72.7 |
Mendelian inconsistencies
The availability of family data in the Genomics England dataset allows us to calculate variant-level Mendelian inconsistencies as an additional metric that can be used for QC purposes. We used over 10,000 trios to calculate Mendel inconsistencies as follows:
- Trios were defined from extended family structures such that:
- Cases of suspected uniparental disomy were filtered out
- Each individual is only present in a single trio
- All members of the trio were consented for data release V9 (not withdrawn)
- Where multiple trios were present in a family (e.g. Mother, Father, Proband, and Mother, Father, Sibling), the trio containing the proband was kept
- Family-wide Mendelian inconsistency rates were calculated across the defined trios
- Families falling outside of the acceptable range of family-wide Mendel errors (mean, +/- 4 standard deviations) were filtered out
- Site specific Mendelian inconsistencies were then calculated across all trios not filtered out in the previous step.
Site specific Mendel inconsistency counts are provided in the INFO field.
Help and support
Please reach out via the Genomics England Service Desk for any issues related to the aggV2 aggregation or companion datasets, including "aggV2" in the title/description of your inquiry.