Labkey desktop application
LabKey is a database containing all the clinical and phenotypic data for de-identified participants in the RE, as well as the results of bioinformatics analysis.

Labkey is available as a desktop application and an API. This guide will walk you through the desktop application. Further documentation describes the API.
This guide will show you how to use the LabKey application. To understand the data itself within LabKey, please visit the pages: Clinical and phenotype data, 100kGP Data Releases and NHS-GMS Data Releases.
Access
To access LabKey, log into the Research Environment and double click on the Desktop application, LabKey. You can then use your same RE credentials to log into LabKey by clicking on 'Sign In' on the top right-hand side of the LabKey application.
Available data
The clinical and phenotypic data in LabKey can be broken down into the following categories:
| Data Type | Description |
|---|---|
| Primary clinical data | These data are captured and submitted by the Genomics Medicine Centres at participant recruitment and follow-up. These data include demographic data, disease characteristics, rare disease and cancer specific clinical and phenotypic data such as recruited disease, family pedigree, laboratory blood tests, HPO terms, tumour morphology and topography. |
| Secondary clinical data | These data are derived from NHS England and Public Health England and comprise additional clinical and phenotypic data that is provided to Genomics England by other data collectors. These data include Hospital Episode Statistics, Diagnostic Imaging, Patient Reported Outcomes Measures, Mortality, and Systemic Anti-Cancer Therapy. |
| Sequencing and sample-level data | These data include the plated-sample data and related QC data associated with the laboratory sample submitted. |
| Genomics England Bioinformatics data | These data comprise outputs from the Genomics England Bioinformatics pipeline such as results from the tiering pipeline, exit questionnaire data, and paths to the genomic data for each participant (BAMs, VCFs, and other meta-data). |
To understand the data itself within LabKey, please visit the pages: Clinical and phenotype data, Main Programme Data Releases and NHS-GMS Data Releases.
Video tutorial
Navigating LabKey
Projects
Upon login, you will be presented with the Projects page. Each of these Project folders represents a different LabKey Project. Depending on your level of access, you may see different Project folders. If you are a member of the Research Network, you will be able to see the Project folders shown and described below.
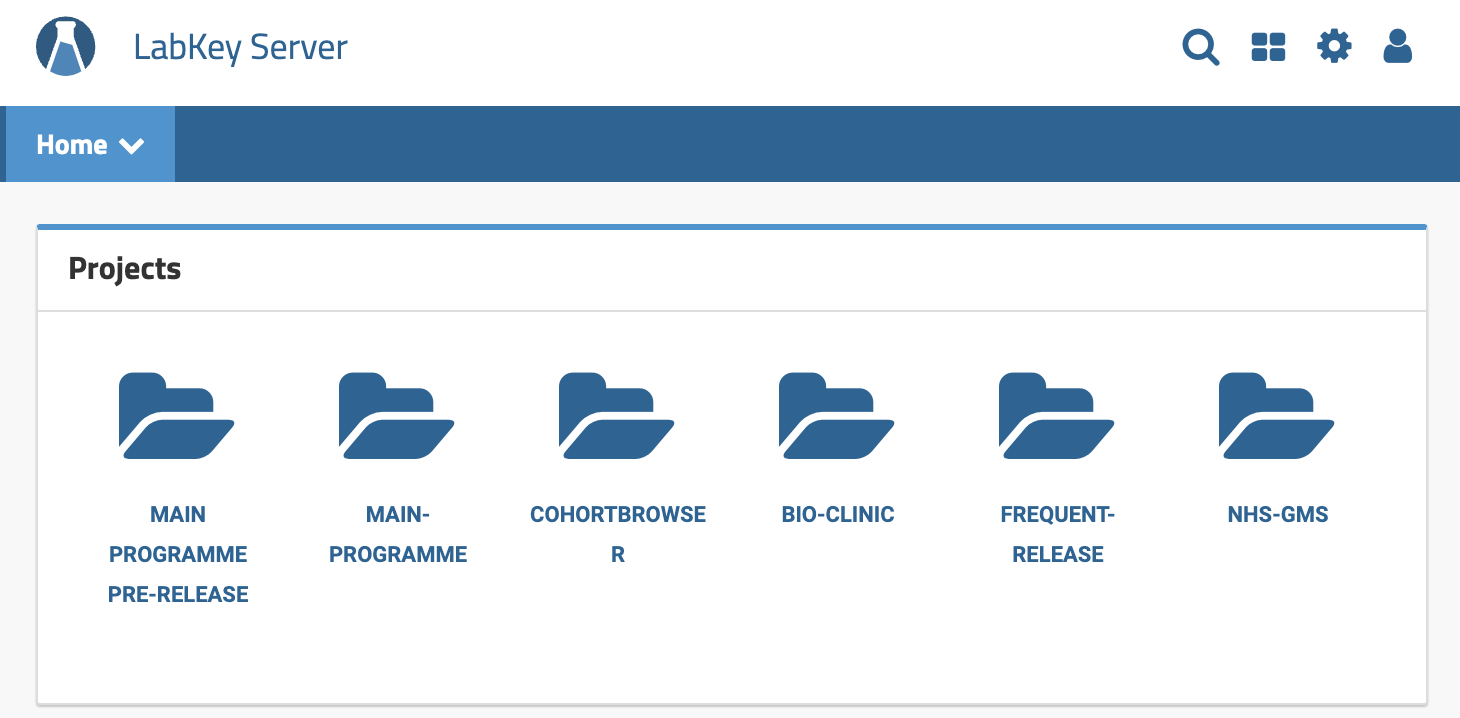
| LabKey Project Name | Description |
|---|---|
| MAIN PROGRAMME PRE-RELEASE | This folder contains the June 2017 "pre-release" of 1,207 participants. These data were released to the "early on-boarding" Research Network group for use in testing the Research Environment. It is no longer advised to use these data as they are consumed within the 100kGP folder. |
| MAIN-PROGRAMME | This folder contains the 100kGP data release which comprises the largest available dataset. Detailed information on the 100kGP data release can be found under: 100kGP Data Releases. Researchers should use the 100kGP Project as it comprises the largest, most up-to-date, and most comprehensive dataset. |
| COHORT BROWSER | This folder contains summary statistics for the data in the 100kGP data release. These data are displayed graphically for easy visualisation of what disease cohorts are available in the 100kGP dataset. It is useful for browsing high-level information on each of the 100kGP data releases. |
| BIO-CLINIC | This folder contains a randomised sub-sample of the 100kGP data release. It is used for demo purposes only and should not be used by researchers. |
| FREQUENT-RELEASE | This folder contains data that is received on a different and/or more frequent schedule than supported by the 100kGP or NHS-GMS release schedule. The Frequent Release data is for participants in the 100kGP and can be joined with that in the latest 100kGP release. |
| NHS-GMS | This folder contains genomic and clinical data for NHS GMS participants. Detailed information on the NHS GMS data release can be found under: NHS-GMS Data Releases. |
The folders and tables you see in the guide may differ from what you see in LabKey. This will be due to either your level of access or subsequent new releases of data.
Data release versions
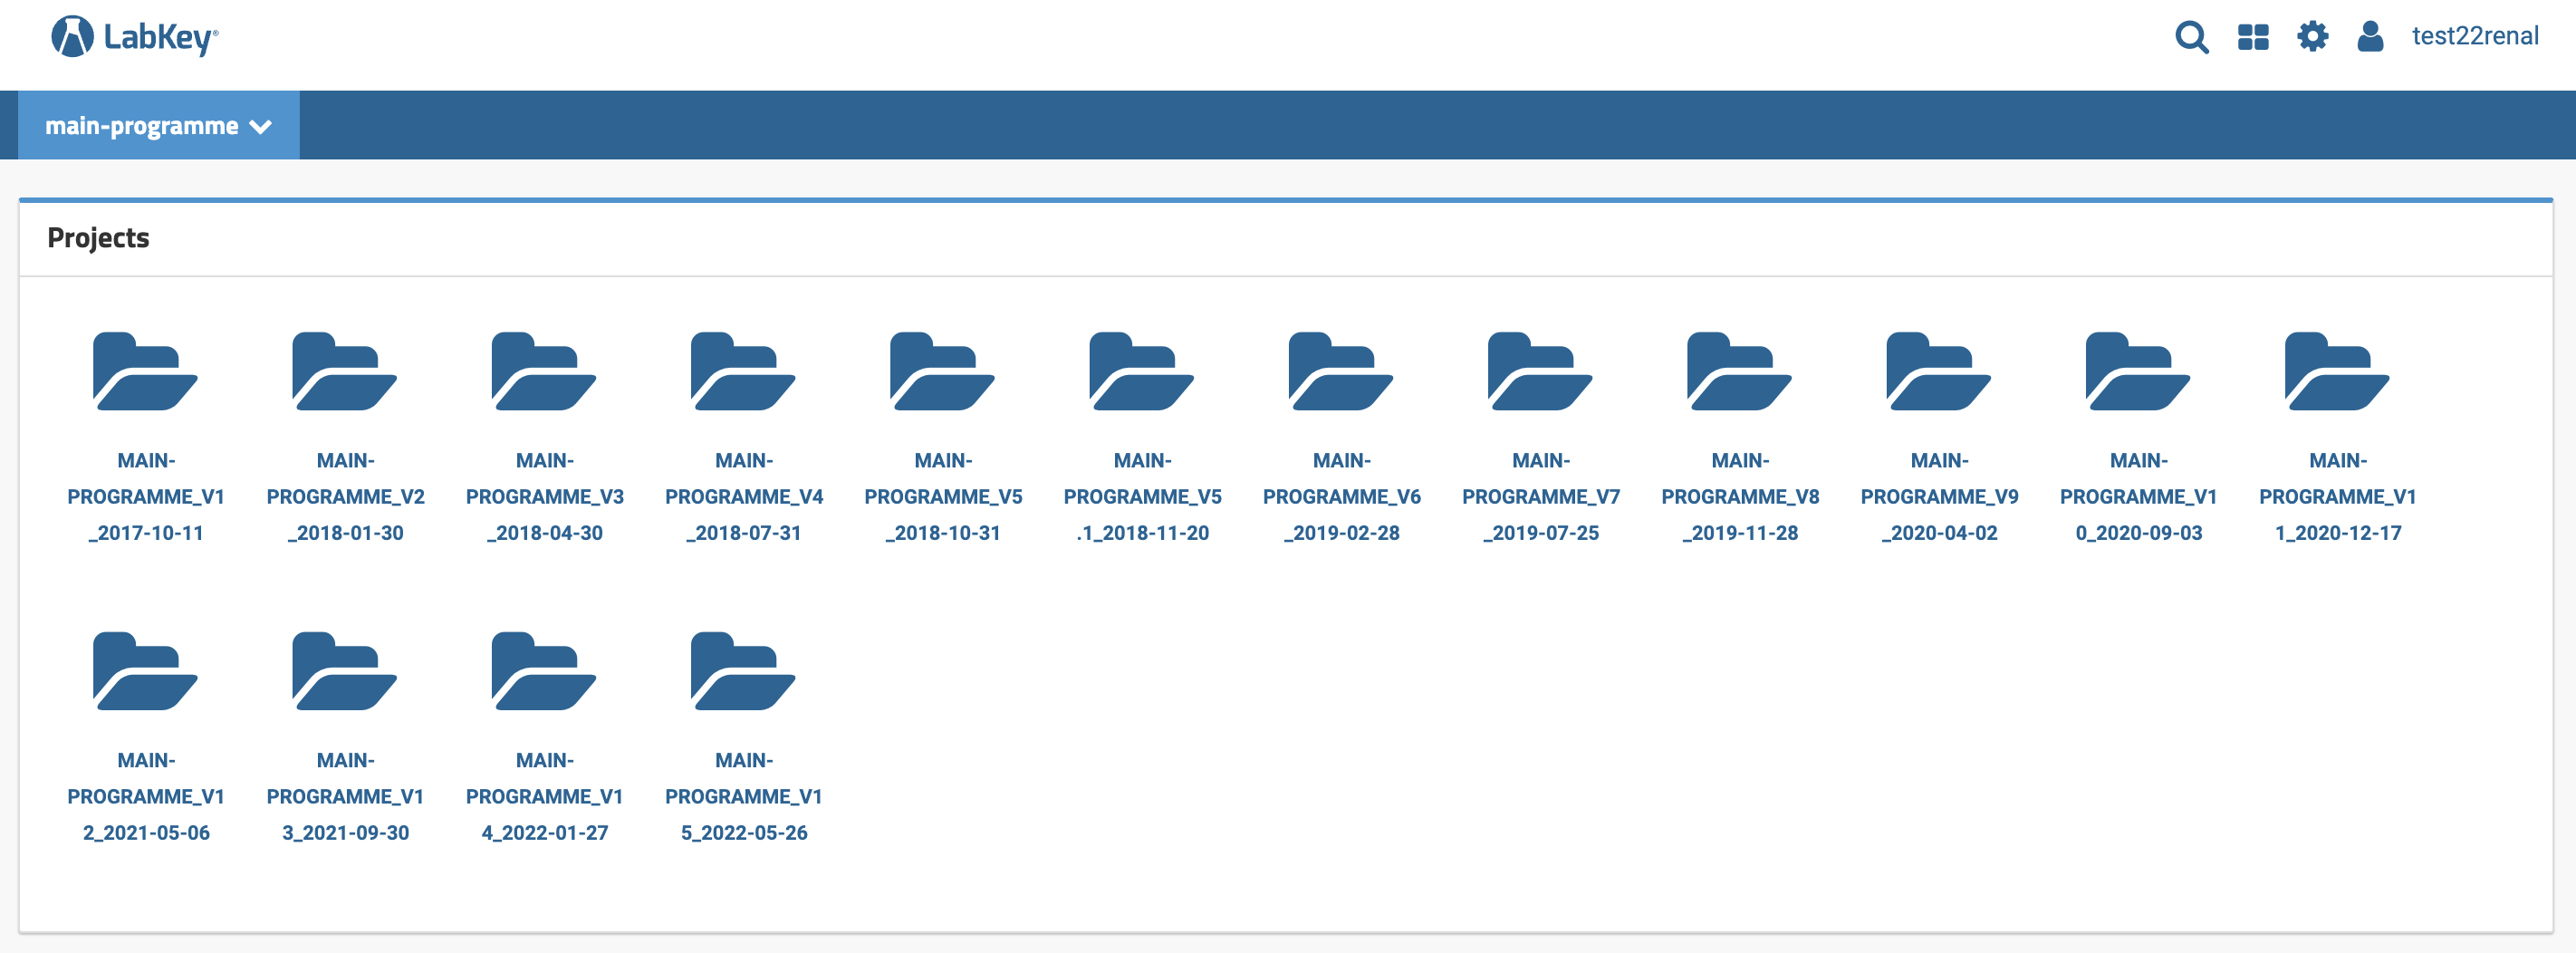
Both the Main Programme (100kGP) and NHS-GMS datasets are updated approximately every three months with additional data as we receive it. Each dataset release is identified by a version number and the release date. Upon selecting the Main Programme Project folder, for example, you will see the list of available Main Programme (100kGP) data releases and their version numbers and release dates. Each of these releases will be shown as a separate sub-folder as shown below. The 100kGP Data Releases and NHS-GMS Data Releases pages will tell you the content of each data release along with any existing changes between releases. We recommend always using the latest Main Programme (100kGP) or NHS-GMS data release as it will comprise the richest dataset.
Tables
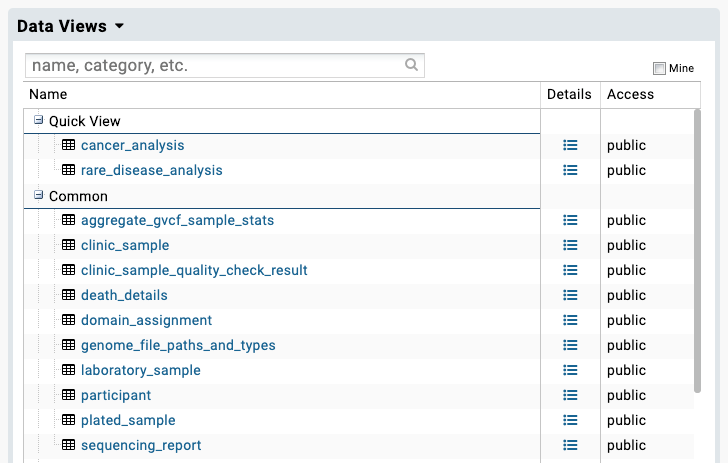
Upon selecting the Main Programme or NHS-GMS release version of your choice, you will be navigated to the Data Views page. This page comprises the list of tables available in the chosen Project. The tables are organised by category, as decribed in our Clinical data documentation.
Browsing data in LabKey
When you click on a table, the table will be displayed in the LabKey application. LabKey tables look and behave a lot like standard spreadsheet files.
Keys: participant_id and platekey
All participants within the Main Programme (100kGP) or NHS-GMS dataset are assigned a unique participant_id. This is a pseudo-anonymised identifier which is unique to each participant. The participant id is found in all tables that describe the participant under the 'Participant ID' column. It can be used to link data across tables as the identifier is unique for each participant.
Tables that describe the sample or sequencing run contain the platekey. Cancer participants, who have both a germline and a somatic sample, will always have two platekeys.
Row numbers
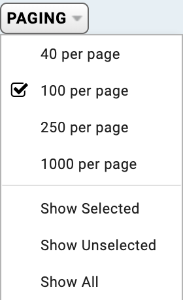
By default, 100 rows of the table are displayed. This can be changed by clicking on the PAGING dropdown button and selecting the number of rows you want to display. If you scroll to the far-right of the table, the total number of rows in the entire table will be displayed. Please be careful as this does not necessarily equal the number of participants in the table. This is because the same participant may be found on multiple rows of a table; for instance, if the participant has many associated disease terms - these will be displayed on multiple rows (one row for each disease term).
Sorting
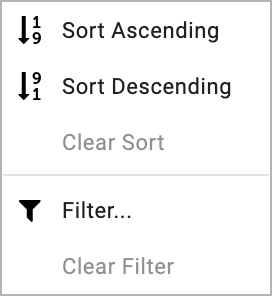
Tables in LabKey can easily be sorted; in acceding or descending order. To do this, click on the column in the table you want to sort. This will open a box which can be used to sort the data in the specified column.
Filtering
Data in table columns can be filtered easily and in many different ways. In order to filter a table, click on the column you want to filter and filter 'Filter...' (as shown above). This will open up a dialog box. By default, the 'Choose Values' filter tab will be displayed. In this tab, you can simply tick the row values you want to retrieve.
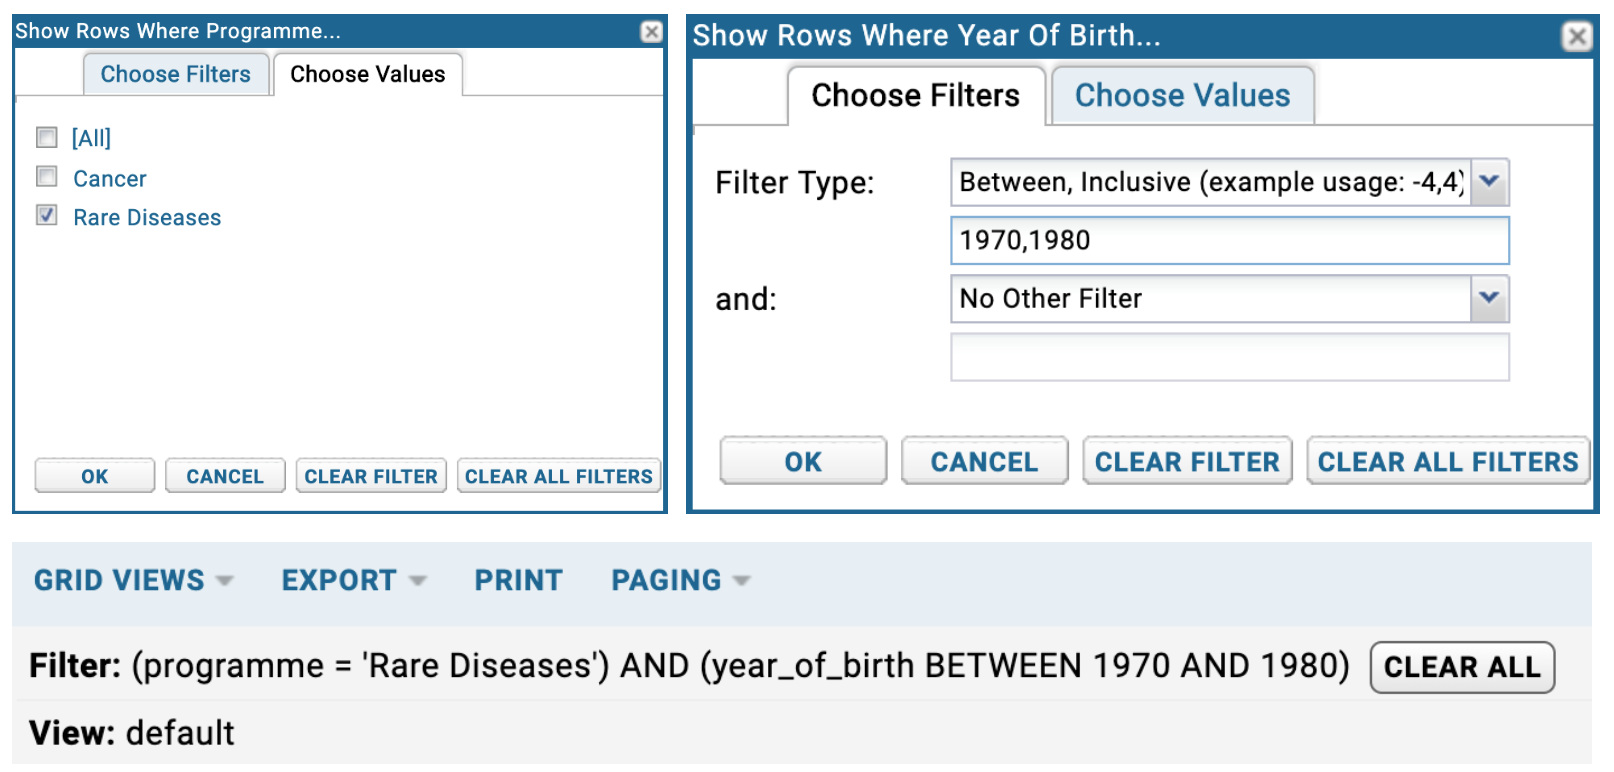
In the below example (top-left), only 'Rare Diseases' will be returned in the Programme column in the participant table ('Cancer' is filtered out from the table). By selecting the 'Choose Filters' tab, you will be able to apply different filter logic by clicking the 'Filter Type'. You will see a list of available filters. In the below example (top-right), the Year of Birth column is filtered for values which are between 1970 and 1980 (inclusive).
The displayed table will have your filters applied . You will be able to see that the total row count of the table will have decreased. You can see this in the top far-right value in the table header.
You can build up as many filters as you like as shown below (bottom). You can clear the filter using the CLEAR ALL button.
Exporting to spreadsheet or text file
Full tables or filtered tables can easily be exported in various different formats. To export a table, click the EXPORT button. The export type can then be chosen from here. Export type includes Excel Workbook (.xlsx) and text file (.csv, .tsv) as shown below. We don't recommend that large tables are exported into an Excel Workbook. It may be better to filter the table down first into a more manageable size.

Video tutorial
Joining across multiple tables
Joining across tables cannot be done directly from the LabKey application. Instead the data must either first be exported (as an Excel Workbook or text file) and joined using LibreOffice Calc, or, the LabKey APIs can be used (see below).
Using the LabKey APIs
The LabKey APIs are a powerful way of connecting with the data and provide consistent, reproducible results, which can be shared with others easily. The LabKey APIs are provided in many programming languages (R, Python, Java...), are simple to use and only require a few lines of code. We always recommend using the LabKey APIs to interrogate the data once an exploratory analysis has been conducted using the LabKey Desktop application. We have written documentation, which includes example code on how to use the LabKey APIs here: Using the LabKey API.