AggV2 Principal Components and genetically inferred relatedness
Using the multi-sample VCFs from aggV2, we have generated Principal Components (PCs) for participants in aggV2 and calculated pairwise relatedness amongst samples. Results from these analyses can be found as flatfiles in the RE and in the aggregate_gvcf_sample_stats table in LabKey.
Generation of high confidence independent SNPs
We generated a set of 195,829 of high confidence LD-pruned biallelic SNPs to be used on all downstream analyses. The SNPs were selected based on the following criteria:
- Include autosomal, bi-allelic SNPs only
- Keep variants which are common (MAF>1%) in both aggV2 and the 1KGP3
- Missingness < 1%
- Median GQ ≥ 30
- Median Depth ≥ 30
- AB Ratio ≥ 0.9
- Completeness ≥ 0.9
- Exclude variants in complex regions, as defined in the 'high LD exclusion regions' file
- Remove all SNPs where the ref/alt combination was AT or GC (A/T, T/A, G/C, C/G), to avoid ambiguous allele swaps
- LD prune using plink version v1.9 with an r2 0.1, 500kb window
- Remove all SNPs which are out of Hardy Weinberg Equilibrium (HWE) in any of the
afr,eas,eurorsassuper-populations, with a p-value cutoff of pHWE < 1e-5
More information on the above filters can be found in the INFO field section of the Site QC, FILTER and INFO Fields page. For the final step, we used a set of 30k high confidence SNPs derived from our aggV1, we inferred ancestry for our aggV2 participants based on this set of SNPs, and filtered for SNPs with a pHWE > 1e-5 in each of the afr, eas, eur or sas super-populations. An overview of this process can be found in on the Site QC, FILTER and INFO Fields page.
The 1KGP3 files used for the intersection with our aggV2 dataset are located at:
/public_data_resources/1000-genomes/20130502_GRCh38/*.vcf.gz
We provide two sets of high-confidence independent SNPs, with a MAF cut-off of 5%, and a MAF cut-off of 1%. These sets comprise 63,523 and 127,747 SNPs respectively. Both sets of high confidence sites can be found in binary plink file format at:
/gel_data_resources/main_programme/aggregation/aggregate_gVCF_strelka/aggV2/additional_data/HQ_SNPs
PCs - aggV2 participants
We run PCA as implemented in GCTA version 1.92.4 using the 63,523 high confidence SNPs with MAF>5%. We calculated PCs based on the set of 55,603 unrelated individuals. Members of the unrelated set are defined in the aggregate_gvcf_sample_stats LabKey table (value of 1). We then projected the remaining 22,592 related individuals onto these PCs with GCTA.
The first 20 PCs are provided in the aggregate_gvcf_sample_stats LabKey table. The first 50 PCs are also provided in the following directory:
/gel_data_resources/main_programme/aggregation/aggregate_gVCF_strelka/aggV2/additional_data/PCs_relatedness/PCA/GEL_PCs
Relatedness inference
Using these SNPs, we generated a pairwise kinship matrix using the PLINK2 implementation of the KING-Robust algorithm.
These were then partitioned into related (up to, and including third degree relationships) and unrelated sample lists using the PLINK2 --king-cutoff relationship-pruning algorithm, with a threshold of 0.0442.
The kinship matrix, along with the list of related and unrelated samples, can be found in:
/gel_data_resources/main_programme/aggregation/aggregate_gVCF_strelka/aggV2/additional_data/PCs_relatedness/relatedness
This folder contains the following files:
#Kinship coefficients in KING table (wide) format for pairwise relationships with kinship coefficient ≥ 0.0442
GEL_aggV2_MAF5_mp10_0.0442.kin0

#Full kinship matrix of all aggV2 pairs in plink triangular binary format
GEL_aggV2_MAF5_mp10.king.bin
GEL_aggV2_MAF5_mp10.king.id

#Lists of unrelated and related individuals
GEL_aggV2_MAF5_mp10.king.cutoff.unrelated.id
GEL_aggV2_MAF5_mp10.king.cutoff.related.id
aggV2 PC plots
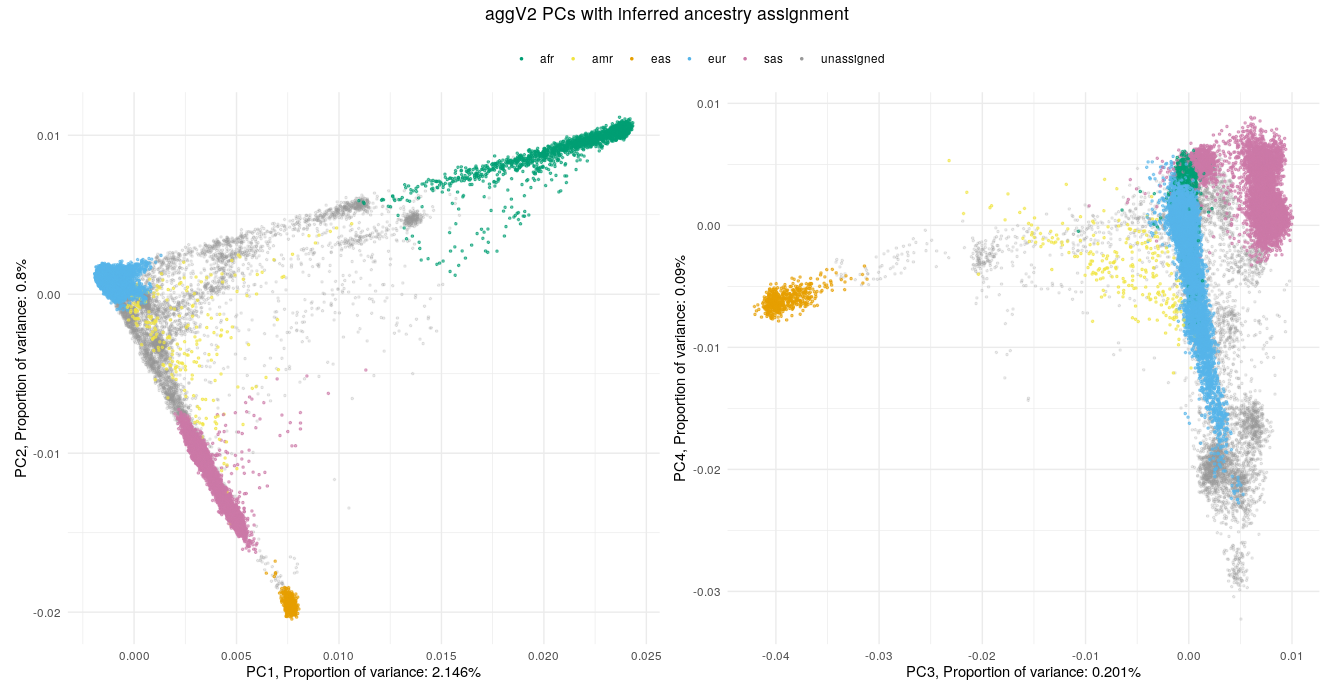
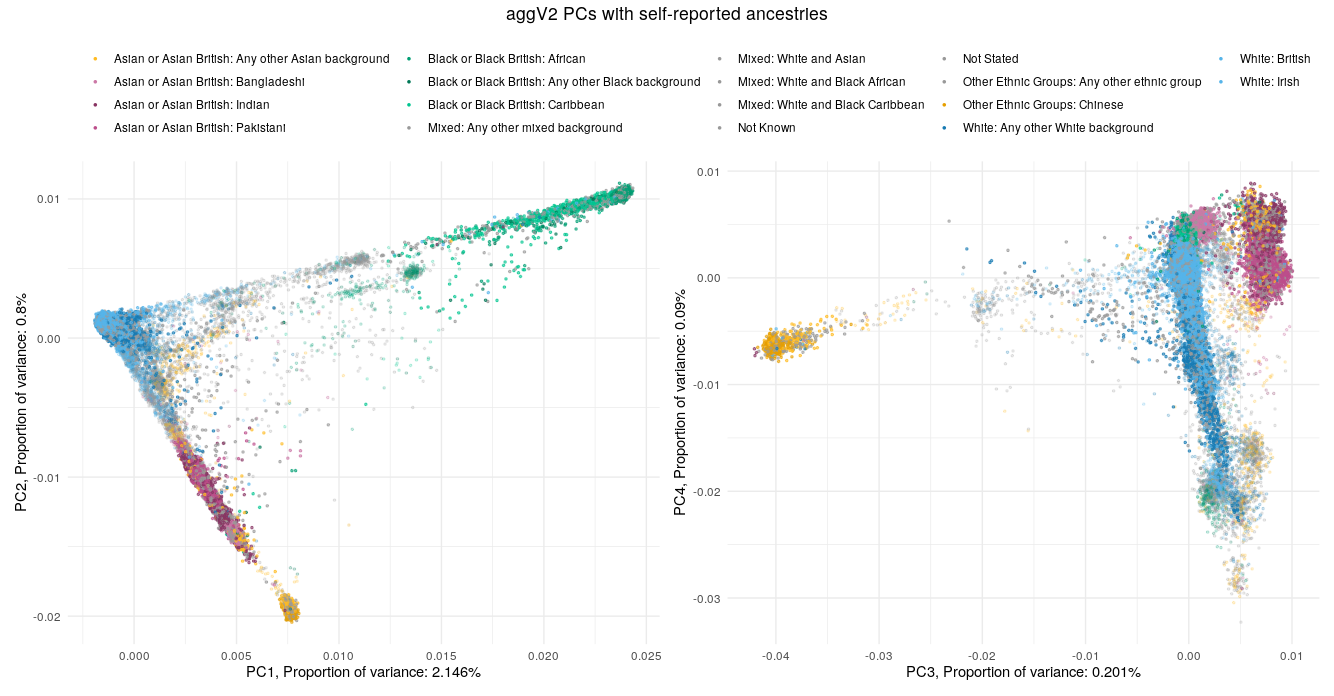
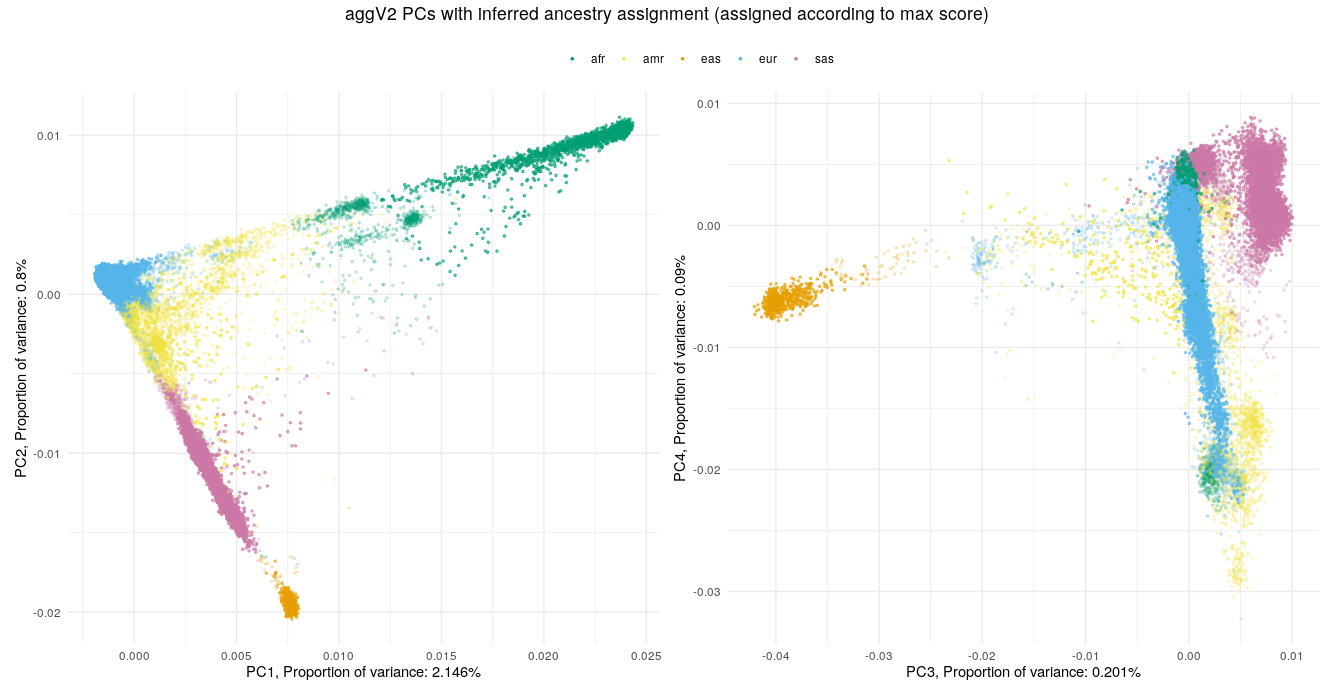
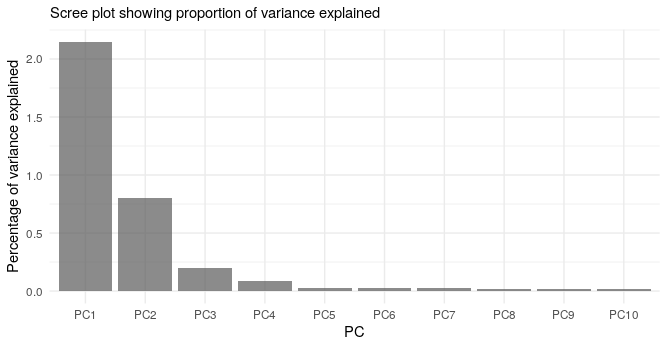
Below we show the first four PCs, derived from PCA on the aggV2 samples. The graphs show, from top to bottom - samples coloured by their inferred super-population (using a threshold of T=0.8), self-reported ancestries (as found in LabKey), and 'best-guess' ancestry based on their inferred super-population. Finally, we show the percentage of variance explained by the first ten PCs.


Help and support
Please reach out via the Genomics England Service Desk for any issues related to the aggV2 aggregation or companion datasets, including "aggV2" in the title/description of your inquiry.