Transcriptomics data
The Genomics England 100kGP Transcriptomics Pilot and Extension comprises RNA-sequencing of a subset of rare disease probands from the 100,000 Genomes Project who did not receive a genetic diagnosis through the Genomics England Interpretation Pipeline (7840 samples from 7829 probands: 5546 samples in the initial Pilot project, 2294 samples in the Extension). We prioritised probands who were found to carry variants of unknown significance.
Priorities were based on:
- Variants highlighted through Splice AI
- Autosomal recessive disorders with only a single pathogenic variant identified
- GLH-selected VUS AND contribution to phenotype partial / unknown AND variant type likely to affect RNA processing
- Based on outcome questionnaire and a call to clinicians
- VUS with a high Exomiser score AND variant likely to results in detectable abnormal RNA processing
- Disorder category ranking by Genomics England on the basis of likely monogenic cause (ranks 1-5) for participants from 1.1 AND no diagnosis in outcome questionnaire
- Call to GLHs / clinicians to propose cases based on strong phenotype for a monogenic disorder with no lead from WGS
- Review whether RNA sample is available or requirement for fresh RNA sample
Datasets available
| Dataset | DRAGEN version | FastQC version | RNA-SeQC version | RSeQC version | Somalier version |
|---|---|---|---|---|---|
| 100kGP Pilot | DRAGEN RNA Pipeline v3.8.4 | 0.11.9 | 2.4.2 | 5.0.1 | 0.2.18 |
| 100kGP Extension | DRAGEN RNA Pipeline v4.2.7 | 0.12.1 | 2.4.2 | 5.0.1 | 0.2.18 |
Protocol
Sequencing
- We derived total RNA from peripheral whole blood prepared using QIAGEN PAXgene Blood RNA Kit.
- We analysed isolated total RNA on an Agilent Tapestation 4200 system for RNA integrity number (RIN) and DV200 quality check.
- We constructed libraries following the Illumina Stranded Total RNA Prep, Ligation with Ribo-Zero Plus kit protocol.
- We sequenced 95 samples per plate (one empty well) simultaneously on the NovaSeq 6000 using 2x100bp paired-end reads.
Data processing
For read alignment, we used the Illumina DRAGEN RNA Pipeline v3.8.4 for the Pilot project and the Illumina DRAGEN RNA Pipeline v4.2.7 for the Extension. We mapped reads to the human genome reference GRCh38 (alt-aware with HLAs) with annotation-assisted alignment, duplicate marking, gene expression quantification, and gene fusion detection enabled. We used GENCODE v32 GTF file for gene annotation. The Illumina DRAGEN aligner and gene expression quantifier are implementations of STAR and Salmon respectively.
Path to the reference genome in the RE:
/public_data_resources/reference/GRCh38DeAlt_HLA/GRCh38_full_analysis_set_plus_decoy_hla.fa
Path to the GTF file in the RE:
/public_data_resources/GENCODE/v32/GRCh38/gencode.v32.annotation.gtf
Data available in the Genomics England Research Environment
As mentioned above, 11 probands contribute two samples each. These were processed independently and can be considered technical replicates.
DRAGEN output and RNA-Seq QC output
Please see the individual Pilot and Extension project pages.
Accompanying QC related Labkey table
A subset of the QC metrics are available in the Labkey table accompanying this dataset, namely rnaseq_qc_metrics. This table can be used to screen samples based on their quality control metrics before conducting any subsequent analysis. Below is a breakdown of the metrics included in the table and the software used to generate them. These metrics were considered the most likely to provide an insight into the quality of a given sample, and thus most valuable during sample screening.
| Column name | Metric | Description | Software |
|---|---|---|---|
participant_id |
Participant ID | Genomics England participant identifier | N/A |
rnaseq_platekey |
RNA-Seq platekey | Sample identifier for RNASeq data | N/A |
wgs_platekey |
WGS platekey | Sample identifier for WGS data | N/A |
rna_folder_path |
RNA (data) folder path | Path to the folder containing RNASeq data for a given sample | N/A |
rnaseqc_total_reads |
Total Reads | Total input alignments | RNA-SeQC 2 |
rnaseqc_mapping_rate |
Mapping rate | Proportion of Mapped Reads (Unique Mapping, Vendor QC Passed Reads that were mapped) to total reads | RNA-SeQC 2 |
rnaseqc_duplicate_rate_of_mapped |
Duplicate rate of mapped | Proportion of Mapped Duplicate Reads to Mapped Reads | RNA-SeQC 2 |
rnaseqc_high_quality_rate |
High quality rate | Mapped Reads that passed the following criteria: aligned as proper pairs, mismatches (NM tag) at or below threshold (--base-mismatch 6), passed mapping quality (MAPQ) threshold (--mapping-quality 60) |
RNA-SeQC 2 |
rnaseqc_exonic_rate |
Exonic rate | Proportion of Exonic Reads (mapped Reads for which all aligned segments unambiguously aligned to exons of the same gene) among Mapped Reads | RNA-SeQC 2 |
rnaseqc_intronic_rate |
Intronic rate | Proportion of Intronic Reads (mapped Reads for which all aligned segments unambiguously aligned to the same gene, without intersecting any of its exons) among Mapped Reads | RNA-SeQC 2 |
rnaseqc_intergenic_rate |
Intergenic rate | Proportion of Intergenic Reads among Mapped Reads | RNA-SeQC 2 |
rnaseqc_rrna_rate |
rRna rate | Proportion of rRNA Reads among Mapped Reads | RNA-SeQC 2 |
rnaseqc_fragment_length_median |
Fragment length median | Median insert size | RNA-SeQC 2 |
rnaseqc_median_3_prime_bias |
Median 3' bias | Median 3’ bias in read coverage | RNA-SeQC 2 |
rnaseqc_median_exon_cv |
Median exon CV | Median coefficient of variation of exon coverage, computed excluding the first and last 500bp of genes, using High Quality Reads mapping fully and exclusively to the gene | RNA-SeQC 2 |
rnaseqc_genes_detected |
Genes detected | Number of genes with at least five (default) High Quality Exonic Reads (--detection-threshold 5) |
RNA-SeQC 2 |
rseqc_gene_body_coverage_skewness |
Gene body coverage skewness | Fishers coefficient of skewness of the gene body coverage calculated by RSeQC | RSeQC (further calculated with "moments") |
somalier_relatedness |
Relatedness | A measure of the degree the similarity of the genotypes at polymorphic loci between matched transcriptomic and WGS DNA samples. | Somalier |
somalier_x_depth_mean |
X depth mean | Mean depth of sites on X chromosome | Somalier |
somalier_y_depth_mean |
Y depth mean | Mean depth of sites on Y chromosome | Somalier |
somalier_x_n |
X n (sites) | Number of sites available on X chromosome in RNAseq sample. This is based on a maximum number of chrX sites present in /public_data_resources/somalier/v0.2.18/sites.*.vcf.gz | Somalier |
somalier_y_n |
Y n (sites) | Number of sites available on Y chromosome in RNAseq sample. This is based on a maximum number of chrY sites present in /public_data_resources/somalier/v0.2.18/sites.*.vcf.gz | Somalier |
somalier_x_hom_ref |
X hom ref | Number of chrX homozygote reference sites found in RNAseq sample. | Somalier |
somalier_x_hom_alt |
X hom alt | Number of chrX homozygote alternate sites found in RNAseq sample. | Somalier |
somalier_x_het |
X het | Number of chrX heterozygote sites found in RNAseq sample. | Somalier |
illumina_rin |
RIN | RNA Integrity Number as measured by an Agilent Tapestation 4200. Values were not used to remove low quality samples before sequencing. All samples were sequenced regardless of their quality in order to define RIN/DV200 thresholds to be used in future RNA-seq projects. | Illumina Provided |
illumina_rin |
DV200 | DV200 (percentage of fragments >200 nt) as measured by an Agilent Tapestation 4200. Values were not used to remove low quality samples before sequencing. All samples were sequenced regardless of their quality in order to define RIN/DV200 thresholds to be used in future RNA-seq projects. | Illumina Provided |
Quality Assessment Summary - Pilot project only
From a subset of the QC metrics we provide a summarised overview below, for the initial Pilot project comprising 5546 samples from 5546 probands. Two samples were observed with extremely high number of reads, and have been excluded from the figures below.
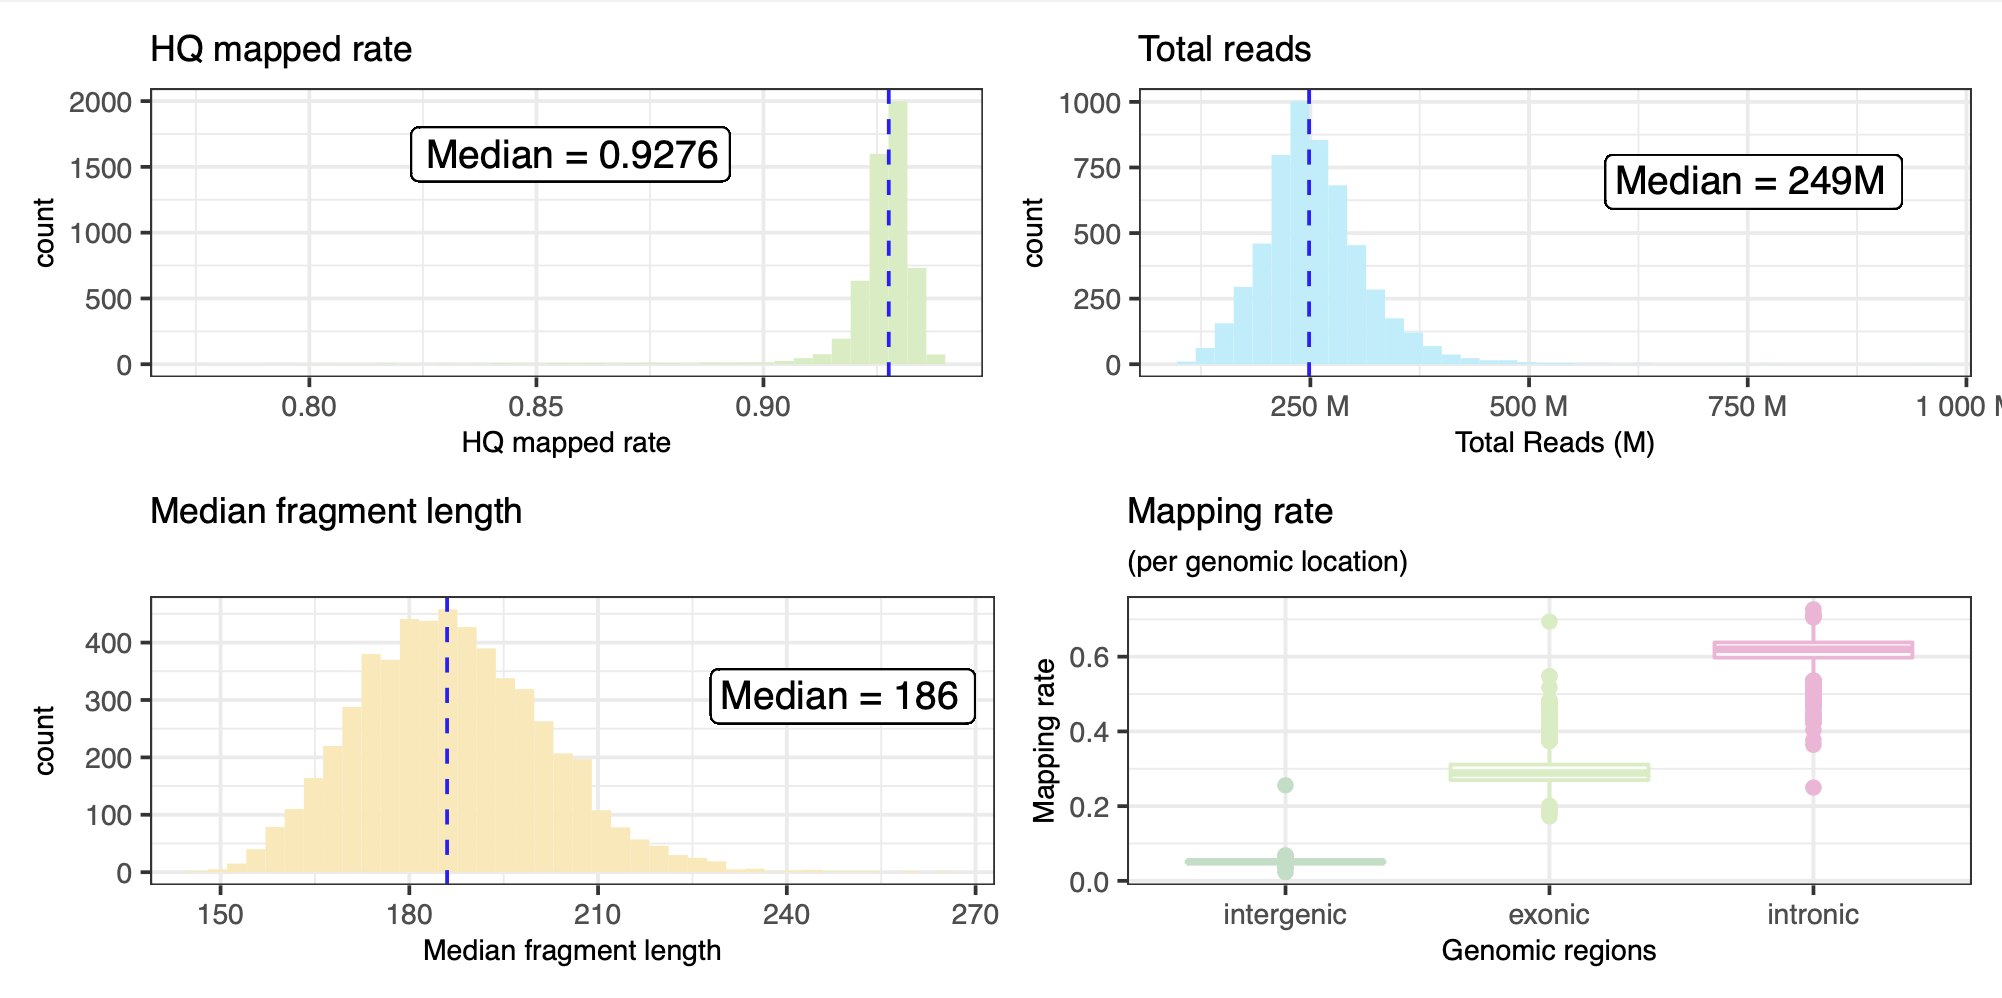
Summary results of the RNASeQ QC pipeline with alignment metrics. Also here, the two samples with extremely high number of reads have been excluded from this table.
| Metric | Min | Q1 | Median | Mean | Q3 | Max |
|---|---|---|---|---|---|---|
rnaseqc_total_reads |
112,939,429 | 217,359,043 | 248,518,554 | 255,393,099 | 285,917,493 | 956,819,802 |
rnaseqc_duplicate_rate_of_mapped |
0.112 | 0.376 | 0.489 | 0.504 | 0.615 | 0.979 |
rnaseqc_exonic_rate |
0.172 | 0.27 | 0.289 | 0.293 | 0.311 | 0.694 |
rnaseqc_fragment_length_median |
145 | 176 | 186 | 186.878 | 196 | 264 |
rnaseqc_genes_detected |
10,731 | 24,943 | 25,999 | 25,685.400 | 26,818.750 | 41,243 |
rnaseqc_high_quality_rate |
0.777 | 0.924 | 0.928 | 0.925 | 0.93 | 0.94 |
rnaseqc_intergenic_rate |
0.023 | 0.049 | 0.051 | 0.051 | 0.053 | 0.256 |
rnaseqc_intronic_rate |
0.25 | 0.597 | 0.62 | 0.616 | 0.638 | 0.727 |
rnaseqc_mapping_rate |
0.64 | 0.953 | 0.966 | 0.96 | 0.975 | 0.995 |
rnaseqc_median_3_prime_bias |
0.336 | 0.47 | 0.491 | 0.489 | 0.507 | 0.643 |
rnaseqc_median_exon_cv |
0.27 | 0.328 | 0.348 | 0.355 | 0.373 | 0.751 |
rnaseqc_rrna_rate |
0 | 0 | 0 | 0 | 0 | 0.024 |
rseqc_gene_body_coverage_skewness |
-2.141 | -1.158 | -1.083 | -1.091 | -1.014 | -0.494 |
Finally, FastQC results are summarised in the table below showing the proportion of flagged samples per category across ten fastQC modules.
| Category | FAIL | WARN | PASS |
|---|---|---|---|
| Adapter Content | 0.5 | 1.2 | 98.3 |
| Overrepresented sequences | 1.3 | 7.6 | 91 |
| Per base N content | NA | 0.1 | 99.9 |
| Per base sequence content | 9.3 | 90.7 | NA |
| Per base sequence quality | 93.5 | NA | 6.5 |
| Per sequence GC content | 53.3 | 44.4 | 2.3 |
| Per sequence quality scores | NA | NA | 100 |
| Per tile sequence quality | 0.6 | 0.4 | 98.9 |
| Sequence Duplication Levels | 99.5 | 0.5 | NA |
| Sequence Length Distribution | NA | 100 | NA |
Help and support
Please reach out via the Genomics England Service Desk for any issues related to the RNA-Seq datasets and tables, including "RNASeq" in the title/description of your inquiry.