Task FAQs
How do I identify compound heterozygous mutations within the Genomics England Dataset?
I'd like to know how to identify participants who have pathogenic variants in both copies of the target gene. I have a list of pathogenic variants and I can identify participants who have a specific variant. However, it is difficult to identify participants who have different pathogenic variants in each copy of the gene (compound heterozygous). Could you let me know how I can do it?
Unfortunately, there is currently no centralised resource to assess compound heterozygous variants within the Research Environment. A research group are currently phasing the entire dataset, so once this is ready, one will be able to interrogate compound hets more easily. We don't have a deadline for this release yet.
There are a few ways to go about assessing compound hets however though some scripting are limitations are involved.
IVA: Firstly, on a family-by-family basis, one can look at interpreted families within IVA using the 'interpretation portal' tab. From here you can click on a family, and then select the 'compound heterozygous' filter. You can then filter for specific genes and consequence types of variants for example.
Tiering: Secondly, if the genes you are interested in are in PanelApp and applied to a family (based on the participant's recruited disease), you will be able to mine the tiering data for compound het mutations as these are flagged within the Rare Disease Interpretation Pipeline. These are based on the filters shown below:
| Single sample Filters | * Affected samples are not 'reference_homozygous' or 'alternate_homozygous' * NonAffected samples are not 'alternate_homozygous' |
| Single sample Selection | * At least one affected is 'heterozygous' or 'alternate_hemizygous' |
| Family Filter1 | * Father and mother are not both reference homozygous for the same variant in the pair. |
| Special Filter | * None of the NonAffected members of the family are heterozygous for both variants in the pair. |
You can access the tiering data in LabKey and filter for segregation pattern = "CompoundHeterozygous".
Scripting: Thirdly, you can script this yourself if you know the structure of the family and the affection status of the individuals. Below is an example of some logic you can apply to flag potential compound hets.
Something like the above is possible. Firstly merge the VCFs of the proband, mother, and father (test.vcf.gz) for the regions you are interested in, then only included variants where the proband is het and mother is ref and father is het, or, the proband is het and the mother is het and the father is ref. Then query out those positions and printed the results to end up with something like:
Which shows the variants with proband, mother, father genotypes. It's possible to query the annotation (gene and consequence type) post VEP annotation.
How do I know if a pathogenic variant with a high allele frequency is true or a variant calling error?
I suspect that a pathogenic variant is the result of a sequencing or variant calling error. In our cancer-oriented project, we have noticed an abnormally high allele frequency in germline VCFs within the MSH2 gene. While studies have shown that germline MSH2 mutations may been linked to hereditary ovarian cancers, we believe the high allele frequency is unlikely to be true.
Could this the result of a sequencing error or a variant calling issue?
This is likely an issue with the variant calling for these regions. For example, chr2:47414419:GT>G (MSH2) has a high allele frequency in individual germline VCFs. However, the BAM files will not support this notion.
More specifically, the region itself, i.e. chr2:47414419-47414422 (GTAA)for brevity, is subsequently followed by a long sequence of A's. When you investigate the individual BAM files of VCFs displaying GT>G, it is more likely to show a deletion of 1x A (chr2:47414420:TA>T). Furthermore, in our germline aggregate (aggV2) chr2:47414419:GT>G is not a PASS variant either.
Variant listed in individual VCF:
But based on the BAM files, the probable case is:
This can lead to false positives when you are working with individual samples. Therefore, we have provided a list of similar known germline variants on our file system. This list is also used by our internal clinical pipelines to ensure a high quality tiering process.
This list can be found here:
/gel_data_resources/cancer_data_files/cancer_pipeline_flagged_variants/
If your variant is not part of this list, please reach out the Genomics England Service Desk so our teams can investigate further.
Is it possible to annotate variants within the Research Environment?
I would like to functionally annotate my variants within the Research Environment to determine what impact they have on my genes of interest. For example if a variant causes gene loss-of-function. Is it possible to do this?
You can functionally annotate variants within the Research Environment using a range of available tools such as VEP, annovar, and SNPEff. We recommend using VEP as it is the most supported of these tools and is kept up-to-date within the Research Environment. You can read more about VEP here: https://www.ensembl.org/info/docs/tools/vep/index.html.
Creating "lollipops" diagrams in the RE
I have a few variants of interest inside the RE, and I want to create a lollipops diagram of my gene of interest including those variants - how can I do that inside the RE?
Programs like lollipops provide this functionality, but usually require an internet connection to work.
However, note that:
- part of this task requires internet connection, in order to get the gene/protein structure information from UniProt and Pfam (this cannot be done inside the RE), but only uses public data...
- ...while part of this task uses participant data (i.e., data that cannot get out of RE), and does not require an internet connection.
Therefore, the suggestion is to "cheat" and split the task into two parts: one to be done outside the RE (e.g. on your local computer with an internet connection), and one to be done inside the RE using the lollipops program.
Say you have a few variants for gene TP53 and want to get your lollipops diagram:
-
Look up gene TP53 human on your machine and translate to UniProt using https://www.uniprot.org/uniprot, e.g.
(look at gene names, find TP53 human => UniProt AC is P04637)
-
Get the JSON for P04637 from the Pfam web service and copy it:
https://pfam.xfam.org/protein/P04637/graphic
(note, copy only the JSON item, i.e. do NOT copy the initial and closing square brackets, only copy everything else in between)
-
Import such text into the RE using the copy/paste (or Airlock for bulk uploads) and save it as text file
lollipops_P04637.json -
In the RE terminal, run:
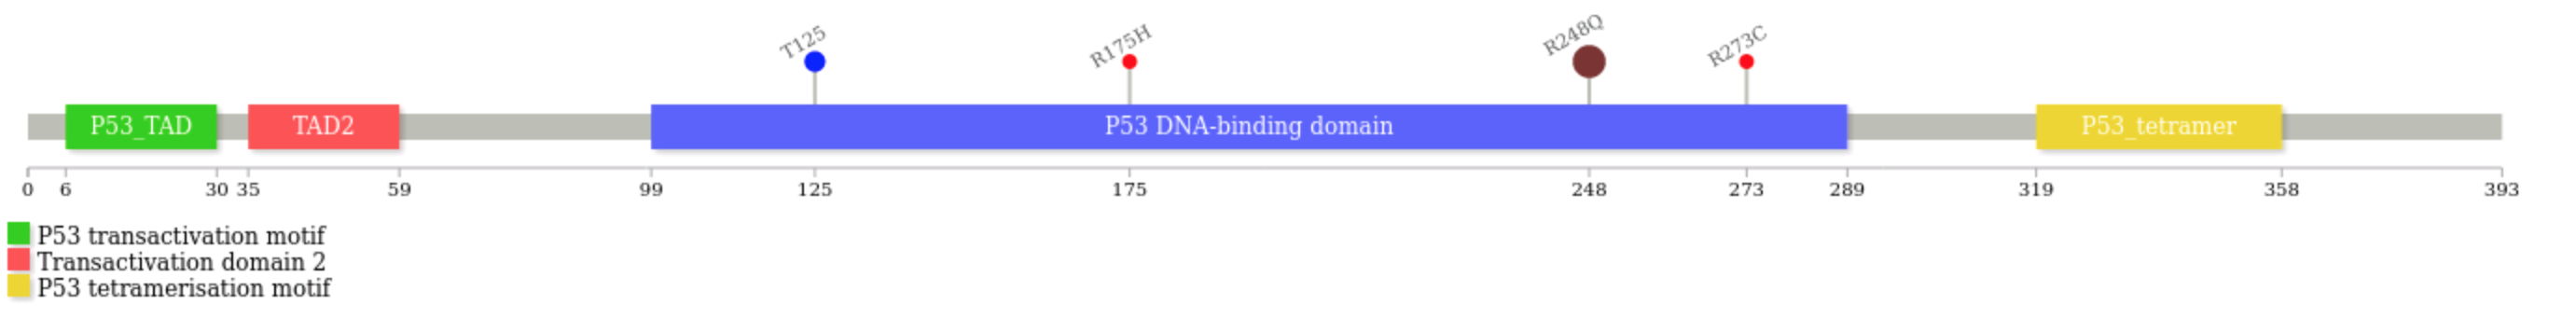
module load lollipops/1.5.2

lollipops -U P04637 -l lollipops_P04637.json -legend -labels R248Q#[[email protected]](/cdn-cgi/l/email-protection) R273C R175H [[email protected]](/cdn-cgi/l/email-protection)
(those are the variants at the end of the command line, in this case they are simply dummy values with no connection to Genomics England participants data - note, do not change the order of the arguments i.e. start with the "
-U" and "-l" arguments) -
Ignore the warning about fonts, and enjoy your diagram
P53_HUMAN.svg(the default output file name is.svg)
-
Each pair of variants in the gene are taken together for the family filter ↩